
The seven agency performance metrics that actually predict dealership revenue are cost per lead (CPL), lead-to-sale conversion rate, conquest rate, aftersales retention rate, service absorption rate, campaign-attributed revenue, and customer lifetime value (CLV). Before your next vendor meeting, take three immediate steps: request the raw lead feed with full field-level data, demand VIN-to-DMS matching for every claimed sale, and require monthly attribution reconciliation against your CRM. Benchmarks from NADA, Demand Local, and Fullpath give you directional targets. Autoroiq's independent scorecards give you the accountability layer.
- Request the raw lead feed (SFTP or secure API) with fields: lead_id, lead_source, utm_params, timestamp, contact_attempts, appointment_date, VIN, sale_date, sale_value
- Demand VIN/DMS matching for every conversion the agency claims
- Require monthly attribution reconciliation comparing vendor totals to CRM and DMS records
Key Takeaways
The seven revenue-predictive agency performance metrics — CPL, lead-to-sale conversion, conquest rate, aftersales retention, service absorption, campaign-attributed revenue, and CLV — are only verifiable when dealerships own their raw data and reconcile it against CRM and DMS records independently.
| Point | Details |
|---|---|
| Seven metrics that matter | CPL, lead-to-sale conversion, conquest rate, aftersales retention, service absorption, campaign-attributed revenue, and CLV predict revenue; impressions do not. |
| Connected data is required | CRM-to-DMS-to-ad-platform integration is the minimum needed to move from vanity metrics to verified campaign-attributed revenue. |
| Demand the raw feed | Require lead_id, utm_params, VIN, sale_value, and timestamps from every agency before approving invoices. |
| Use a weighted scorecard | Weight campaign-attributed revenue at —, lead-to-sale at 20%, CPL at —, conquest at —, CLV at —, and retention/absorption at 10%. |
| Autoroiq | Autoroiq delivers independent vendor scorecards and raw data reconciliation using dealer-owned CRM and DMS data, with no advertising sold. |
Table of Contents
- The 7 agency performance metrics that predict dealership revenue
- Why connected data is the foundation of real attribution
- How to build and use a vendor performance scorecard
- What reports to demand and how often
- Benchmarks for U.S. dealerships and how to adapt them
- Six steps to audit an agency's performance claims
- Why independent measurement changes the outcome
- What Autoroiq delivers for dealerships that want independent accountability
- Sources
The 7 agency performance metrics that predict dealership revenue
Measuring ROI in automotive retail makes the core problem plain: most dealership marketing reports track clicks and impressions that never follow a buyer from a digital touchpoint to the showroom. Connected CRM-to-DMS-to-marketing data is what closes that gap. Each metric below is defined with a formula, its primary data sources, a directional US benchmark, and a validation check.
1. Cost per lead (CPL)
Definition: Total ad spend divided by verified leads received in the same period.
Formula: CPL = Total Ad Spend / Total Verified Leads
Data sources: Ad platform spend report + CRM lead count by source
Benchmark: Demand Local's analysis puts US vehicle-sales search CPL at roughly a range around $40, with $50 as a useful directional ceiling.
Validation check: Compare the vendor's reported lead count to your CRM's inbound count for the same source and date range.
2. Lead-to-sale conversion rate
Definition: The percentage of agency-sourced leads that result in a vehicle sale.
Formula: Conversion Rate = (Sales Attributed to Agency Leads / Total Agency Leads) × 100
Data sources: CRM lead records matched to DMS deal records by lead_id or VIN
A rate above average suggests strong lead handling.
Validation check: Pull CRM leads by source, then cross-reference against DMS closed deals. Missing lead_ids in the DMS are the most common sign of fabricated conversions.
3. Conquest rate
Definition: The share of sold units where the buyer was not previously in your CRM or service history.
Formula: Conquest Rate = (New-to-File Buyers / Total Units Sold) × 100
Data sources: DMS deal records + CRM history lookup by customer name, phone, and email
Validation check: Deduplicate against 36 months of CRM history. Vendors who claim high conquest numbers without providing buyer-level data are reporting an unverifiable figure.
4. Aftersales retention rate
Definition: The percentage of vehicle buyers who return to your service department within 12 months.
Formula: Retention Rate = (Buyers Returning for Service / Total Buyers in Cohort) × 100
Data sources: DMS service records matched to sales records by customer ID
Benchmark: NADA data consistently shows that dealers who retain service customers generate significantly higher back-end gross per unit over a 36-month window.
Validation check: Match the sale cohort from 12 months prior to current service visit records. Gaps in customer ID linkage indicate DMS data hygiene issues, not agency performance.
5. Service absorption rate
Definition: The percentage of fixed-operations gross profit that covers total dealership overhead.
Formula: Absorption Rate = (Service + Parts Gross Profit / Total Dealership Overhead) × 100
Data sources: DMS financial statements (fixed ops gross, total overhead)
Validation check: This metric is pulled directly from the DMS financial module. If an agency claims credit for absorption improvement, ask for the specific campaigns tied to service RO increases.
6. Campaign-attributed revenue
Definition: Total gross revenue from deals where the agency's campaign was a verified touchpoint in the buyer's path.
Formula: Attributed Revenue = Sum of (Sale Value × Attribution Weight) for all matched deals
Data sources: Ad platform impression/click logs + CRM lead records + DMS deal records, joined by lead_id or VIN
Benchmark: No universal standard exists; the goal is to calculate cost-per-vehicle-sold-attributable-to-digital and compare it to your average front-end gross per unit.
Validation check: Ask the agency for the specific lead_ids or VINs behind every attributed sale. An agency that cannot produce this list is reporting estimated, not verified, revenue.
7. Customer lifetime value (CLV)
Definition: The projected total gross profit a customer generates across sales and service over their relationship with the store.
Formula: CLV = (Average Transaction Value × Purchase Frequency × Customer Lifespan) minus Acquisition Cost
Data sources: DMS sales and service history by customer ID, CRM engagement records
Benchmark: Fullpath's research on dealership customer data highlights that CLV calculations anchored to real DMS history produce materially different budget allocation decisions than CPL-only thinking.
Validation check: Segment CLV by lead source. If agency-sourced leads produce below-average CLV, the CPL may look acceptable while the actual economics are negative.
Why connected data is the foundation of real attribution
Connected data is not optional. Without a live link between your CRM, DMS, and ad platforms, campaign-attributed revenue is an estimate at best and a fabrication at worst.
The practical path forward is incremental. Start with VIN matching: every deal in the DMS carries a VIN, and every lead in the CRM should carry a lead_id. Joining those two tables by lead_id or customer record gives you a verified conversion list that no vendor can dispute. Layer UTM parameter hygiene and call-tracking source codes on top of that to capture digital-to-phone paths.
Attribution model selection matters less than data completeness. Last-touch attribution is the easiest to implement and sufficient for most single-rooftop stores. Position-based (40/20/40) is worth adopting when you run multi-channel campaigns and want to credit both the first awareness touchpoint and the final conversion driver. Multi-touch data-driven models require at least several hundred conversions per month to produce statistically stable weights.
Pro Tip: Insist on a minimum data schema before signing any agency contract: lead_id, lead_source, ad_cost, vin_or_sale_id, sale_value, and timestamps for lead creation and sale close. Without these six fields, attribution reconciliation is impossible.
How to build and use a vendor performance scorecard
A scorecard forces vendor meetings to move from highlight reels to accountability. The table below shows suggested weightings for the seven metrics, with the columns the Think Better vendor accountability framework recommends dealers track.
Score each metric 1–5 against your target benchmark, multiply by the weight, and sum to 100. A vendor scoring below 60 on two consecutive monthly reviews warrants a formal performance conversation. Below 50 triggers a contract review.
Red flags that should escalate immediately:
- Agency retains ownership of ad accounts, analytics accounts, or audience lists
- No raw lead feed available; vendor provides only a dashboard summary
- Programmatic or OTT CPMs cannot be traced to effective rates after intermediary margins. TMG Intelligence audits found effective CPMs sometimes three to four times the quoted rate when supply-chain markups are traced
- VIN linkage is missing from any claimed conversion
- Vendor-reported lead totals differ from CRM inbound counts by more than 10%
Pro Tip: Require the agency to deliver the raw lead feed via SFTP or secure API, with column specs documented, before approving the next invoice. Data ownership stays with the dealership.
What reports to demand and how often
Dealer Insights recommends four numbers as the minimum for shifting vendor meetings from highlights to accountability: engagement-per-dollar, budget pacing, leads distribution by vendor, and VDP views trend over time.
Build those into a formal cadence:
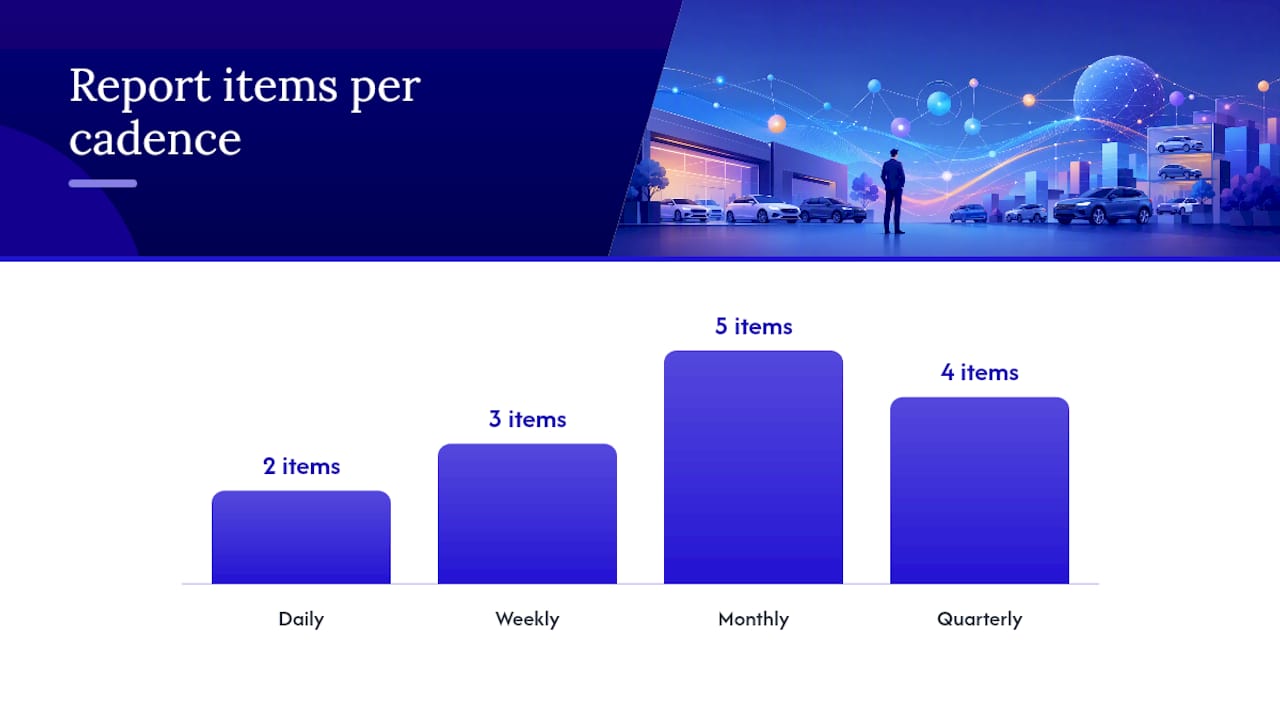
- Daily: Raw lead feed delivery (automated); budget pacing alert if spend deviates more than 10% from plan
- Weekly: Spend reconciliation by channel; VDP views per session trend; lead volume by source vs. prior week
- Monthly: Full attribution reconciliation (vendor totals vs. CRM vs. DMS); CPL by channel; lead-to-sale rate; conquest rate; scorecard update
- Quarterly: CLV update by lead source cohort; service absorption review; benchmark reset against NADA and Fullpath published data; contract performance review
Your dashboard must surface at minimum: campaign-attributed revenue, CPL by channel, lead-to-sale rate, VDP views per visit, brand-search lift (measured via Google Search Console or a third-party brand-tracking tool), and service retention rate.
Raw lead feed column spec to demand from every agency:
| Field | Description |
|---|---|
| lead_id | Unique identifier assigned at lead creation |
| utm_source / utm_medium / utm_campaign | Full UTM string from the originating ad |
| source_id | Vendor or platform identifier |
| timestamp | datetime of lead submission |
| contact_info | Phone and email (for CRM deduplication) |
| appointment_status | Scheduled / showed / no-show |
| sale_vin | VIN if a sale occurred |
| sale_value | Gross sale amount |
| sale_date | Date of DMS deal close |
Flag any retroactive changes to delivered reports. Require version control: each report file should carry a delivery timestamp, and any amendment must be documented with a change log entry.
Benchmarks for U.S. dealerships and how to adapt them
Directional benchmarks give you a starting point, not a verdict. Adjust every target for your store's volume, inventory mix, and regional market before holding a vendor to it.
- CPL: $38–$42 for vehicle-sales search campaigns is the directional US average from Demand Local's analysis; display and social CPLs run higher and should be evaluated against VDP view quality, not raw lead count.
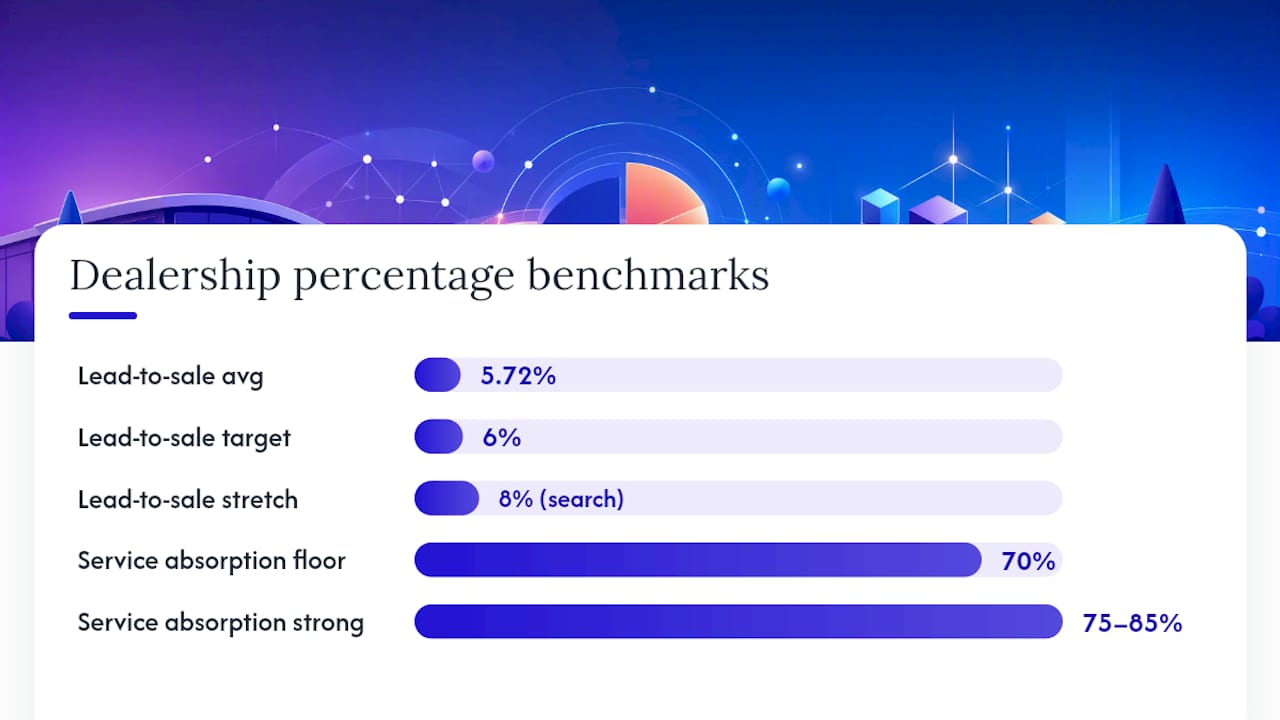
- Lead-to-sale conversion: 5.72% average; set your internal target at 6% for agency-sourced leads and 8% as a stretch goal for high-intent search leads.
- Service absorption: 70% is the NADA floor; stores with strong fixed ops typically run 75–85%
- CLV: Calculate your store's average CLV from DMS history before setting any agency target; a store averaging $4,200 front-end gross and two service visits per year per customer has a very different CLV floor than a high-volume used-car operation
To calculate cost-per-vehicle-sold-attributable-to-digital: divide total digital spend by the number of DMS-verified sales where a digital lead_id is present. Compare that figure to your average front-end gross. If the cost per attributed VIN exceeds front-end gross, the channel is underwater regardless of what the CPL looks like.
For benchmark-setting cadence: use conservative targets for the first 90 days with a new vendor, move to standard targets at 90 days if data quality is confirmed, and set stretch targets only after 6 months of clean, reconciled data.
Six steps to audit an agency's performance claims
Vendors will self-report metrics that favor them. Hrizn's attribution guidance is direct: set KPIs in advance and measure results using dealer-owned CRM and DMS data, not vendor dashboards.
-
Get the raw spend and lead feed. Request the full raw files, not a summary. Confirm column specs match what was agreed in the contract.
-
Reconcile totals. Compare vendor-reported lead count to CRM inbound count by source and date. Run:
SELECT COUNT(*) FROM crm_leads WHERE source = 'vendor_name' AND created_date BETWEEN [start] AND [end]. A gap above 10% requires explanation. -
Verify lead-to-sale matching by VIN. Join CRM leads to DMS deals on lead_id or customer record. Any claimed sale without a matching lead_id in the CRM is unverified.
-
Check CPL plausibility. Divide reported spend by reported leads. If the resulting CPL is below $20 for a vehicle-sales search campaign, the lead count is likely inflated or the spend figure is incomplete.
-
Review multi-touch attribution logic. Ask the agency to document their attribution model in writing. If they cannot, they are using last-touch by default. Confirm that model matches what was agreed in the scope of work.
-
Escalate if data gaps persist. If the agency cannot produce a VIN-matched conversion list within 5 business days of request, pause spend on that channel and demand a data audit before resuming. Require account-level access to all ad platforms in the dealership's name before reinstating budget.
Pro Tip: *When onboarding a new vendor, run your existing attribution model and the vendor's model in parallel for 90 days. The delta between the two models is your measurement risk.
Signs of likely misreporting include: missing lead IDs, implausible CPLs given reported spend, and vendor-reported totals that don't reconcile with CRM records.
Why independent measurement changes the outcome
Most dealerships are measuring vendor performance with the vendor's own ruler. That is not a criticism of agencies as a category. It is a structural problem: when the same party that runs your campaigns also controls the dashboard that reports on them, the incentive to surface underperformance is weak. The scorecard, raw feed requirements, and audit checklist in this guide are designed to give you a dealer-owned measurement layer that no vendor can edit retroactively.
The practical steps above — VIN matching, attribution reconciliation, and a weighted scorecard — are not adversarial. They are the conditions under which a good agency can prove its value and a poor one cannot hide. Independent measurement protects the relationship with vendors who are genuinely performing and accelerates the decision to change course when they are not.
What Autoroiq delivers for dealerships that want independent accountability
Most dealerships spend significant marketing budgets without a vendor-agnostic layer to verify what is actually working. Autoroiq provides exactly that: independent marketing performance reviews, vendor scorecards, and ongoing advisory built entirely on dealer-owned CRM and DMS data, with no advertising sold and no vendor relationships to protect.

Autoroiq's engagements deliver three things: a raw data reconciliation that compares vendor claims to CRM and DMS records line by line, a weighted vendor scorecard calibrated to your store's volume and inventory mix, and a monthly advisory cadence that keeps your measurement framework current as campaigns and vendors change. A typical initial review is completed within two to three weeks of data access. Ongoing advisory engagements run month-to-month with no long-term lock-in.
If you are ready to measure your agency's performance against revenue outcomes rather than impressions, request an independent review from Autoroiq.
Sources
- Measuring ROI in automotive retail (Keyloop)
- How to hold auto marketing vendors accountable: 4 data points every GM needs | Dealer Insights
- Marketing attribution for dealerships: what's working? | Hrizn