
The most defensible approach to direct mail attribution combines incrementality-first measurement with direct response identifiers. Run a holdout (lift) test to prove causal impact, layer in unique offer codes (UOCs), personalized URLs (PURLs), QR codes, and dedicated phone numbers to capture direct responses, then close the loop with matchback analysis against your transaction records. That hybrid method gives you both campaign-level performance data and statistically valid proof that the mail itself drove revenue.
Core building blocks to implement now:
- Unique offer codes and PURLs per recipient or cohort, so every response ties back to a specific mailpiece
- Unique QR codes that route to UTM-tagged landing pages, capturing scan-level data by household
- Dedicated tracking phone numbers routed through a call-tracking platform and logged in your CRM
- Matchback analysis that compares your mailing list to transaction records using address or email matching
- A holdout (lift) test with a randomized control group withheld from the mailing
Set your attribution window at about a month or more for most campaigns. Direct mail converts more slowly than digital, and reading results too early can produce false negatives leading to premature campaign cuts. For considered purchases like vehicles, a longer window is advisable. Lob's KPI guidance recommends aligning the window to your actual sales cycle, commonly 30–90 days, rather than defaulting to a fixed interval.
Key Takeaways
A hybrid attribution approach combining unique identifiers, matchback analysis, and holdout testing gives marketing analysts the most defensible measurement of direct mail's causal impact on revenue.
| Point | Details |
|---|---|
| Use a hybrid method | Combine PURLs, QR codes, UOCs, matchback, and a holdout test for both direct and causal attribution. |
| Set the right attribution window | Use 30–90 days aligned to your sales cycle; reading results before the window closes produces false negatives. |
| Size holdout groups before mailing | Confirm statistical power with a sample-size calculator before committing the list to avoid underpowered tests. |
| Route all responses into CRM | Tag every response with campaign_id, creative_id, and source_directmail to enable reproducible matchback and reporting. |
| Deduplicate before reporting | Remove double-counts from overlapping identifier and matchback attribution before calculating ROMI or CPA. |
Table of Contents
- What direct mail attribution models are available, and when should you use each?
- How do you track responses from a direct mail campaign?
- How do you design and run a lift test for direct mail?
- How do you integrate direct mail data into your CRM and analytics?
- What does a hybrid attribution strategy look like in practice?
- What KPIs and measurement checklist should you use for direct mail?
- What do direct mail attribution programs typically cost and how long do they take?
- What are the most common direct mail attribution mistakes, and how do you avoid them?
- What practitioners actually encounter when running these tests
- Sources
What direct mail attribution models are available, and when should you use each?
Direct mail attribution falls into two broad categories: direct attribution and indirect (incrementality) attribution. Direct attribution measures responses that can be tied to a specific mailpiece through an identifier, such as a PURL visit, QR scan, or code redemption. Indirect attribution measures the causal lift the mailing produced by comparing a mailing group to a holdout group that received nothing. Both matter, and neither alone tells the full story.
Single-touch and multi-touch models
Single-touch models assign 100% of credit to one interaction. First-touch credits the mailpiece that introduced the customer; last-touch credits the final touchpoint before conversion. For direct mail, last-touch is particularly misleading because a customer who received a mailer, visited a website, and then converted through a paid search ad will have the mail's contribution erased entirely.
Multi-touch models distribute credit across the customer journey:
- Linear: equal credit to every touchpoint. Simple, but it treats a brand-awareness mailer the same as a conversion-driving offer.
- Time-decay: more credit to touchpoints closer to conversion. Useful when mail is used as a late-funnel nudge.
- U-shaped (position-based): 40% to first touch, 40% to last touch, 20% split across the middle. Works well when mail opens the relationship and a digital channel closes it.
- W-shaped: adds a third emphasis point at the lead-creation stage. Relevant for B2B or high-consideration purchases.
- Full-path (data-driven): uses algorithmic weighting based on observed conversion paths. Requires significant data volume to be reliable.
Advanced approaches: matchback, MMM, and Bayesian models
Matchback analysis ties your mailing list to transaction records by matching addresses, emails, or other identifiers. It provides campaign-level attribution even when recipients never enter a code, making it the workhorse method for most direct mail programs. The catch: matchback cannot distinguish between customers who converted because of the mail and those who would have converted anyway.
That gap is where regression-based media mix modeling (MMM) and Bayesian attribution earn their place. MMM fits a statistical model across all your marketing channels and isolates the contribution of each, including direct mail, over time. Bayesian models update prior beliefs about channel effectiveness with new campaign data, making them well-suited for programs with limited historical data. Both approaches are covered in more depth in Autoroiq's media mix modeling guide.
Which model fits your objective?
| Objective | Recommended model |
|---|---|
| Prove causal impact of mail | Holdout / lift test (incrementality) |
| Campaign-level performance reporting | Matchback analysis |
| Cross-channel budget allocation | MMM or data-driven multi-touch |
| Creative or offer A/B testing | Holdout test with creative variants |
| Executive ROI reporting | Hybrid: matchback + lift test |
How do you track responses from a direct mail campaign?
USPS Delivers identifies six core tracking methods: PURLs, QR codes, unique offer/activation codes, business reply cards, dedicated phone numbers, and social links. Combining multiple methods on a single mailpiece reduces leakage from recipients who ignore one CTA but respond through another.
The six primary tracking identifiers
-
Personalized URLs (PURLs): Generate a unique subdomain or path per recipient (e.g.,
firstname.yourdomain.comoryourdomain.com/ref/ABC123). Use variable-data printing to embed the URL on each piece. The landing page should be mobile-first, load in under three seconds, and pass the recipient's identifier to your CRM via a hidden form field or query parameter. -
Unique QR codes: Print a distinct QR code per household or cohort. Each scan hits a UTM-tagged URL that records the campaign ID, creative version, and list segment. Per-household QR codes let every scan name the exact household that responded, enabling the most granular attribution available in direct mail.
-
Unique offer codes (UOCs): Assign a distinct alphanumeric code per recipient or cohort. Redemption at checkout, in-store, or online ties the transaction directly to the mailpiece. Keep codes short (6–8 characters) to reduce entry errors.
-
Dedicated tracking phone numbers: Provision a unique number per campaign or creative variant using a call-tracking platform. Route calls through the platform before forwarding to your main line, logging caller ID, call duration, and campaign metadata in your CRM. Autoroiq's call tracking guide covers platform selection for dealership environments.
-
Business reply cards (BRCs): Pre-addressed, postage-paid cards that recipients mail back. Useful for audiences with lower digital engagement. Print a barcode or batch ID on each card to identify the campaign and list segment on return.
-
In-store redemption codes: For retail or dealership environments, a printed code presented at the point of sale ties the transaction to the mailing without requiring any digital interaction.
Matchback: how to run it and keep data clean
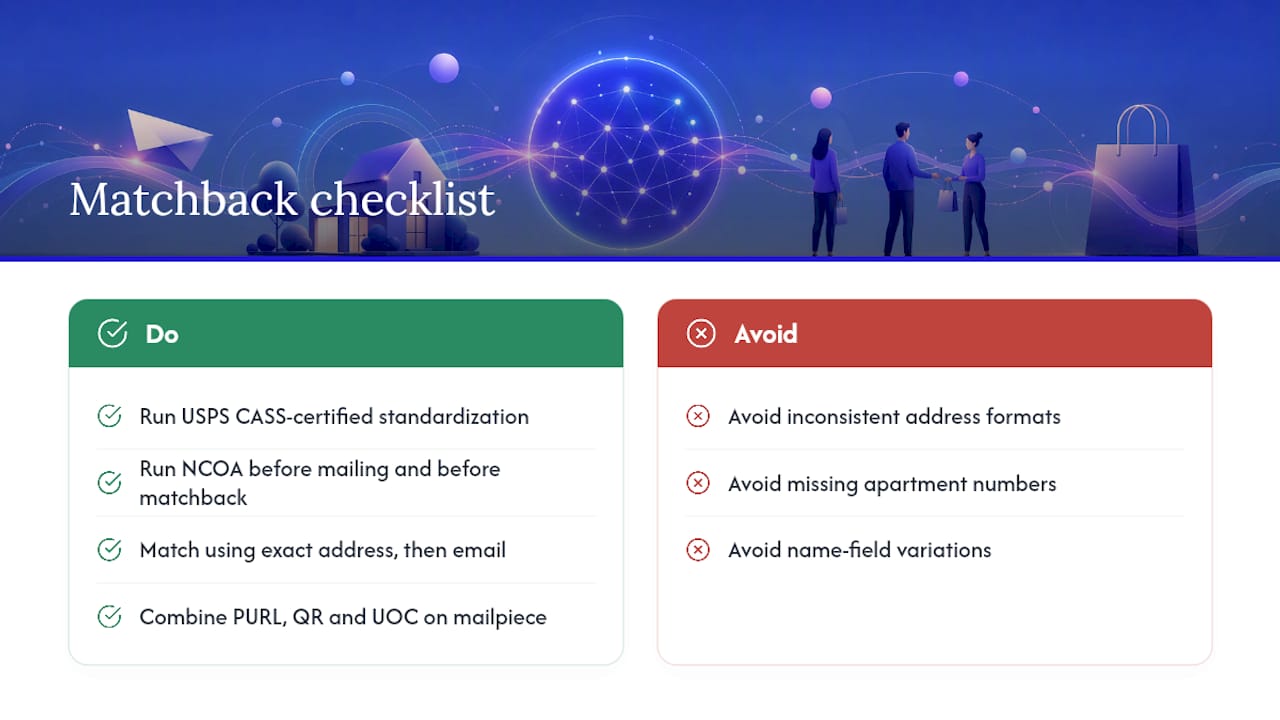
Matchback compares your mailing list to your transaction records over the attribution window. The process: export purchasers from your CRM or POS system, normalize addresses using USPS CASS-certified address standardization, then match against the mailed list using a deterministic rule set (exact address match, then email match as a secondary key). Flag matched records as source_directmail = true and tag them with campaign_id, list_cohort, and mail_date.
Data hygiene is the most common failure point. Inconsistent address formats, missing apartment numbers, and name-field variations all reduce match rates. Run NCOA (National Change of Address) processing on your list before mailing and again before the matchback to catch movers.
Pro Tip: Combine a PURL, a unique QR code, and a UOC on the same mailpiece. Recipients who scan the QR, visit the PURL, or redeem the code each generate a trackable event, so you capture responses from all three behavioral types rather than losing the segment that ignores any single CTA. Recipients who scan the QR, visit the PURL, or redeem the code each generate a trackable event, so you capture responses from all three behavioral types rather than losing the segment that ignores any single CTA.
How do you design and run a lift test for direct mail?
Holdout testing is the preferred method for measuring indirect attribution: compare a mailing group to a holdout group and calculate incremental revenue or customer lift as the difference between the two groups. It is the only method that answers the question "Would these customers have converted anyway?"
Step-by-step holdout test design
-
Define your population. Start with the full list of eligible recipients: customers or prospects who meet your targeting criteria. Document the selection rules before randomization.
-
Randomize the assignment. Split the population randomly into a treatment group (receives the mail) and a holdout group (receives nothing). Randomization must happen at the individual or household level, not by geography or list segment, to avoid systematic bias.
-
Size the groups correctly. Your holdout group needs enough members to detect a meaningful lift. As a rule of thumb, if your baseline conversion rate is 2% and you want to detect a 0.5 percentage-point lift with 80% statistical power, you need several thousand records in each group. Use a power calculator (G*Power is free and widely used) to confirm the required sample size before you commit the list.
-
Apply exclusion rules. Remove anyone who received a different direct mail piece in the same window, anyone in an active digital retargeting campaign that could contaminate the holdout, and any known recent purchasers who are in a post-sale blackout period.
-
Mail the treatment group and suppress the holdout. Confirm the holdout suppression file is loaded in your mail platform before the job runs. A single batch error that mails the holdout group invalidates the test.
-
Wait for the attribution window to close. Direct mail typically requires 4–6 weeks for results to stabilize. For high-consideration purchases, extend to 60–90 days.
-
Calculate lift. Revenue lift = Revenue(mailing group) minus Revenue(holdout group). Customer lift = Customers(mailing group) minus Customers(holdout group). Express lift as a percentage of the holdout group's baseline to normalize for group-size differences.
-
Assess statistical significance. Run a two-proportion z-test or chi-square test on conversion rates. A p-value below 0.05 is the conventional threshold, but also evaluate practical significance: a statistically significant lift of 0.1% may not justify the mailing cost.
Example incremental ROI calculation
Suppose your treatment group of 10,000 households produces 220 conversions at an average order value of $400, while your holdout group of 10,000 produces 180 conversions at the same AOV. Incremental customers: 40. Incremental revenue: $16,000. If the mailing cost $8,000 (printing, postage, creative), incremental ROMI = ($16,000 minus $8,000) / $8,000 = 100%. That is a defensible number you can take to a budget meeting.
When response rates are low and sample sizes are constrained, consider cohort-level experiments or pooling tests across similar markets rather than running an underpowered holdout that will never reach significance.
How do you integrate direct mail data into your CRM and analytics?
Feeding direct mail signals into your CRM and web analytics is what separates a one-time measurement exercise from a repeatable attribution system. Lob's implementation guidance recommends generating unique CTAs per recipient or cohort and wiring them into your analytics stack so direct attribution works like email campaign tracking.
Metadata to capture at send time
Every mailpiece should carry a structured metadata record in your CRM or campaign management system before it ships:
campaign_id: unique identifier for the campaigncreative_id: version of the mailpiece (A/B variant)list_cohort: the audience segment (e.g., lapsed customers, conquest prospects)piece_id: per-household identifier when using unique PURLs or QR codespurl_id: the specific PURL assigned to this recipientmail_date: the date the job was submitted to the mail housesource_directmail: boolean flag for downstream filtering
Using delivery events to trigger workflows
Postal delivery events (Processed for Delivery, Delivered) from platforms like Amsive's MultiTrac feed piece-level visibility into your analytics system. When a delivery event fires, trigger a follow-up email or SMS to the same household within 24–48 hours. Recipients who receive a digital touchpoint at the moment of physical delivery convert at higher rates than those reached by mail alone, because the message arrives when the piece is in hand.
REmail's implementation checklist covers the operational steps: buy unique phone numbers per campaign, build campaign-specific landing pages with UTM parameters, link QR codes to UTM-tagged pages, and set CRM campaign tags to capture incoming leads automatically.
Privacy and compliance
Store all PII collected through PURLs, form fills, and call tracking in systems that comply with CCPA (for California residents) and any applicable federal regulations. Set a data retention policy before the campaign launches, not after. For audiences that include EU residents, apply GDPR-equivalent consent and data minimization standards. Transmit PII over encrypted connections only, and restrict access to raw response data to personnel with a documented business need.
Test every integration end-to-end before the mail job runs: submit a test PURL visit, place a test call to the tracking number, and confirm both events appear in your CRM with the correct campaign metadata attached.
What does a hybrid attribution strategy look like in practice?
A hybrid approach uses direct identifiers for campaign-level performance visibility and holdout tests for causal proof. Neither method alone is sufficient: identifiers tell you who responded, but not whether they would have converted without the mail; holdout tests prove incrementality but cannot attribute individual conversions to specific households.
The operational workflow
- Segment and suppress. Define treatment and holdout groups before list finalization. Load the holdout suppression file into your mail platform.
- Embed identifiers. Assign PURLs, QR codes, and UOCs via variable-data printing. Confirm all identifiers are live and routing correctly before the job ships.
- Monitor delivery. Use postal delivery event feeds to confirm pieces are reaching households and to time any follow-up digital touches.
- Collect responses. Aggregate PURL visits, QR scans, code redemptions, and call-tracking logs into a single campaign response table in your CRM.
- Run matchback. At the close of the attribution window, match purchasers to the mailing list. Tag matched records with campaign metadata.
- Calculate lift. Compare conversion rates between treatment and holdout groups. Compute incremental revenue and ROMI.
- Report and iterate. Share a daily scoreboard (delivery status, early response counts) for operational monitoring, and a final stabilized lift report for budget decisions.
When to prioritize quick wins vs. lift testing
For campaigns under 5,000 pieces, a statistically valid holdout test is often impractical. In those cases, rely on UOCs and PURLs for direct attribution and use matchback to estimate campaign-level performance. Reserve holdout testing for your highest-volume campaigns, where the incremental revenue at stake justifies the measurement investment.
Per-household unique codes pay back most clearly for high-LTV customers: a dealership mailing service reminders to its existing owner base, for example, can justify the variable-data printing cost because each incremental service visit carries a known margin. For conquest prospect mailings with lower conversion rates, cohort-level identifiers (one QR code per list segment rather than per household) reduce printing complexity while still providing segment-level attribution.
USPS Delivers and MPA's tracking service overview both note that combining multiple identifiers on a single piece reduces tracking leakage, which is the single most practical step most programs can take immediately.
What KPIs and measurement checklist should you use for direct mail?
Pre-campaign checklist
- List hygiene completed: NCOA processing, CASS address standardization, duplicate suppression
- Holdout group defined and suppression file loaded in mail platform
- All identifiers (PURLs, QR codes, UOCs, tracking phone numbers) generated and tested
- Landing pages live, mobile-optimized, and passing UTM parameters to CRM
- Call-tracking numbers routing correctly and logging to CRM
- Matchback rules documented: primary key (address), secondary key (email), attribution window defined
- Privacy and data retention policy confirmed before any PII is collected
Core KPIs and how to calculate them
| KPI | Formula | Typical benchmark |
|---|---|---|
| Response rate | Responses / Pieces mailed | 1%–5% for consumer direct mail |
| Conversion rate | Conversions / Responses | Varies by offer and channel |
| Incremental lift | (Treatment conv. rate minus Holdout conv. rate) / Holdout conv. rate | Campaign-specific |
| Incremental revenue | Incremental customers × Average order value | Campaign-specific |
| Cost per acquisition (CPA) | Total campaign cost / Incremental conversions | Compare to digital CPA benchmarks |
| Return on mail investment (ROMI) | (Incremental revenue minus Campaign cost) / Campaign cost | Target positive; a majority is strong |
| Payback period | Campaign cost / Monthly incremental revenue | Shorter is better for cash flow |
Lob's KPI framework recommends setting an attribution window that reflects your actual sales cycle, commonly 30–90 days, rather than a fixed interval. A dealership measuring service appointment bookings might close the window at 30 days; one measuring vehicle purchases should extend to 60–90 days.
Reporting cadence
Run a daily delivery and early-response scoreboard for operational monitoring. At week two, review early response counts to confirm tracking is functioning, but do not make optimization decisions yet. Publish the final stabilized report only after the full attribution window closes.
What do direct mail attribution programs typically cost and how long do they take?
Setup costs
One-time setup work includes variable-data printing configuration, dedicated phone number provisioning, landing-page development, and CRM field mapping. For a team building these capabilities in-house, expect 2–6 weeks of setup time depending on CRM complexity and whether landing pages need to be built from scratch.
Recurring costs include PURL hosting, call-tracking platform fees (typically billed per number and per minute), and per-piece unique-code generation if using a managed service. Managed services that tag every piece, host response pages, and feed a live dashboard reduce internal labor but add a per-piece or monthly platform fee.
Cost complexity tiers
- Low complexity: cohort-level QR codes, one tracking phone number, shared landing page with UTM parameters. Minimal incremental printing cost; primary expense is call-tracking subscription and landing-page setup.
- Medium complexity: per-cohort PURLs, unique QR codes per list segment, two or three tracking numbers, CRM integration. Adds variable-data printing setup and CRM mapping work.
- High complexity: per-household unique PURLs and QR codes, managed delivery event feeds, holdout test design and analysis, full CRM pipeline integration. Highest printing and platform costs, but produces the most granular attribution data.
Timeline expectations
Setup and integration: 1–6 weeks. Campaign production and mailing: 1–2 weeks from file submission to delivery. Attribution window: 4–6 weeks for most consumer campaigns; 8–12 weeks for high-consideration purchases. Full holdout test cycle from design to final analysis: 8–12 weeks. Budget the full cycle when presenting a measurement roadmap to finance or leadership.
What are the most common direct mail attribution mistakes, and how do you avoid them?
Red flags to watch for
- Last-click bias: attributing all credit to the final digital touchpoint erases the mail's contribution entirely. Use multi-touch or hybrid attribution to distribute credit across the customer journey.
- Double-counting: a customer who redeems a UOC and is also matched in the matchback gets counted twice. Deduplicate on a unique customer identifier before reporting.
- Small sample sizes: a holdout test with 500 records per group will almost never reach statistical significance at typical direct mail response rates. Size groups before committing the list.
- Holdout contamination: if holdout members receive the mail through a data error, or are exposed to a parallel campaign targeting the same audience, the test is invalid. Audit suppression files before every job.
- Poor address normalization: inconsistent address formats reduce matchback accuracy and undercount conversions. Run CASS standardization on both the mailing list and the transaction file before matching.
- Attribution leakage: offline purchases made in-store without presenting a code will not appear in your digital tracking. Supplement digital identifiers with in-store redemption codes or POS-level matchback.
Mitigation tactics
Use deterministic matching rules with a documented hierarchy (address first, email second, phone third) and log every step of the matchback process for reproducibility. Randomize holdout groups at the individual level, not by geography. Apply conservative attribution windows rather than extending them to inflate results. Require a pre-registered analysis plan for every lift test: document your hypothesis, sample size calculation, and significance threshold before the mail drops. Keep raw response data and intermediate matchback outputs in version-controlled storage so any analyst can audit the methodology.
For dealerships, Autoroiq's marketing waste analysis identifies vendor report reconciliation as a persistent source of double-counting, particularly when multiple vendors claim credit for the same conversion. Independent matchback and holdout analysis resolves that conflict with data rather than negotiation.
What practitioners actually encounter when running these tests
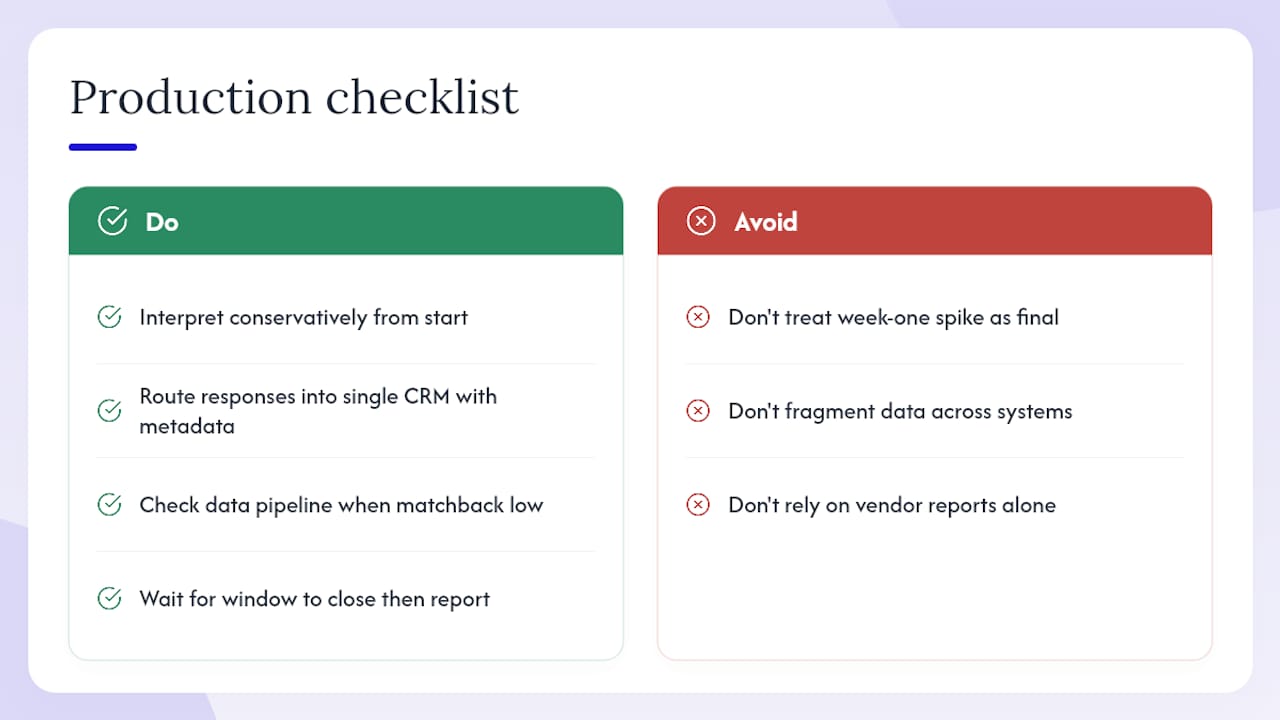
The gap between a well-designed attribution plan and what happens in production is wider than most teams expect. Delivery anomalies, CRM sync delays, and address normalization failures are routine, not exceptional. The practical implication: build conservatism into your interpretation from the start. If your matchback returns a 3% match rate when you expected 8%, investigate the data pipeline before concluding the campaign underperformed.
The single most effective operational step is routing all mail responses into a single CRM record with consistent campaign metadata attached. Fragmented data, where PURL visits live in one system, call logs in another, and matchback outputs in a spreadsheet, makes reproducible attribution nearly impossible. A unified campaign response table, even a simple one, is worth more than a sophisticated model built on disconnected data.
One surprise that catches teams repeatedly: early-response spikes in the first week after delivery that taper sharply by week three. The temptation is to read the week-one numbers as the campaign result. They are not. Direct mail attribution requires the full window to stabilize, and the final lift figure is almost always lower than the early spike suggests. Wait for the window to close, then report.
Autoroiq applies this same discipline when evaluating direct mail performance for automotive dealerships: independent incrementality testing and matchback analysis, run against a single source-of-truth dataset, produce the defensible ROI metrics that dealership executives can use to make budget decisions without relying on vendor-supplied reports. More on that methodology is available at Autoroiq's insights hub.
Sources
The sources below back the methods described in this article and provide implementation detail for teams building or refining their direct mail attribution programs.
- Measure and improve your direct mail results — Klaviyo Academy
- Track direct mail ROI — USPS Delivers
- Measuring attribution — Lob Help Center
- A guide to direct mail attribution — Lob
- Direct Mail Tracking: How to Measure Campaign Results (2026) | REmail
- MultiTrac® | Direct Mail Tracking Platform by Amsive