
Lead-to-sale conversion measures the share of leads that become paying customers, calculated as total new customers divided by total leads. Most B2B teams land between 1.1% and 3.5%, while top-performing SaaS operations can push past 5% with tight qualification. Improving conversion rates is often achieved by faster, prioritized follow-up with real qualification rather than simply generating more leads.
- Benchmark range: roughly 1% to 4% for most B2B pipelines. Higher for referral-driven or high-intent inbound.
- One prioritized action: cut speed-to-lead and add a scoring filter before routing.
Statistic to anchor on: Decisive sales outcomes often require about six contact attempts, yet most sales teams abandon a lead after one or two tries. That gap alone explains more lost revenue than any ad budget shortfall.
Key Takeaways
Lead-to-sale conversion improves fastest when teams pair defensible cohort measurement with faster, more persistent, better-qualified follow-up rather than simply buying more leads.
| Point | Details |
|---|---|
| Use the right formula | Calculate (New Customers ÷ Total Leads) × 100, and track stage-to-stage rates separately. |
| Benchmark in context | Expect roughly 1% to 4% for most B2B pipelines, higher for referrals and inbound. |
| Measure with cohorts | Align tracking windows to your actual sales cycle instead of monthly snapshots. |
| Fix speed and persistence first | Set SLAs under 30 minutes and follow up around six times before giving up. |
| Run an independent check when stuck | An outside review can catch attribution errors in-house teams tend to miss. |
Table of Contents
- What Is the Lead to Sale Conversion Formula?
- What Is a Good Lead to Sale Conversion Rate?
- How Do You Measure Lead to Sale Conversion Reliably?
- What Tactics Actually Improve Lead to Sale Conversion?
- What Should a Lead to Sale Conversion Dashboard Include?
- Why Is My Lead to Sale Conversion Rate Low?
- How Does an Independent Marketing Audit Improve Conversion?
- Our Take on What Actually Moves This Number
- Sources
What Is the Lead to Sale Conversion Formula?
The core formula is simple: (Total New Customers ÷ Total Leads) × 100. Run 1,000 leads through your pipeline and close 20 of them, and your rate is 2%. That single number hides a lot, though, which is why stage-to-stage variations matter more for diagnosing problems.
- Top-line rate: New Customers ÷ Total Leads × 100
- MQL-to-SQL rate: Sales-Qualified Leads ÷ Marketing-Qualified Leads × 100
- SQL-to-Opportunity rate: Opportunities ÷ Sales-Qualified Leads × 100
- Opportunity-to-Close rate: Won Deals ÷ Opportunities × 100
For dealerships or any business with a sales cycle longer than a few days, a monthly snapshot rate is close to useless. Leads generated in October might not close until December, so comparing October's lead count to October's sales count understates performance and confuses everyone in the room. Cohort analysis fixes this: group leads by the month they entered the funnel, then track that same cohort's conversion over 60 or 90 days, matched to your actual average sales cycle length.
What Is a Good Lead to Sale Conversion Rate?
Context decides whether a number is good. A 1.1% to 3.5% range covers most B2B businesses, but complex, high-ticket sales with long cycles often sit at the low end while transactional, lower-price offers sit higher.
- B2B, complex/enterprise deals: roughly 1% to 3%, reflecting longer cycles and multiple stakeholders.
- B2C or transactional B2B: often 3% to 8%, since the buying decision is faster and cheaper.
- Referral and relationship leads: can run three to five times higher than cold outbound.
- Organic and content-driven leads: typically outperform purchased lists because intent is already established.
A rate that looks "low" is not automatically a problem. A dealership pulling 2% from a huge, unqualified paid-lead pool might convert better dollar-for-dollar than a "high-converting" 6% channel that only generates a trickle of leads. Read conversion rate alongside volume and cost per lead, never in isolation.
How Do You Measure Lead to Sale Conversion Reliably?
The number is only as good as the definitions behind it. Marketing and sales need to agree, in writing, on what counts as a "lead" and what counts as a "conversion" (a signed deal, first payment, or delivered vehicle, for example). Without that agreement, marketing reports one number and sales reports another, and both sides spend meetings arguing about whose math is wrong instead of fixing the funnel.
- Align cohort windows to your actual average sales cycle, not an arbitrary calendar month.
- Instrument the full path: CRM for pipeline stages, marketing automation for lead source and engagement, and closed-loop attribution to tie closed deals back to their original channel.
- Break out channel-level rates separately. A blended average hides the fact that referrals are carrying paid search.
- Watch for attribution caveats: multi-touch journeys, offline touches like phone calls, and delayed CRM updates all distort the raw number if left unaccounted for.
A structured funnel with clear Awareness, Consideration, Conversion, and Loyalty stages gives you a framework for where to instrument. Buyers complete most of their research before ever contacting a vendor, so a lot of the "conversion" work is already happening upstream of your first call.
Pro Tip: Build one shared dashboard that both marketing and sales log into daily. If each team is pulling numbers from separate exports, you will always end up debugging spreadsheets instead of the funnel.
What Tactics Actually Improve Lead to Sale Conversion?
Execution beats volume. Adding more leads to a slow, unqualified process just multiplies the waste. Here's the priority order that tends to move the number fastest:
- Fix speed-to-lead first. Set a hard SLA (30 minutes or less for inbound) and automate routing so leads never sit in a shared inbox waiting for manual triage. Response speed is consistently one of the biggest predictors of whether a lead ever gets contacted at all.
- Qualify before you route. Score leads on fit (ICP, firmographics, budget signals) and behavior (page visits, form fills, pricing-page revisits). Trial depth and repeat visits to a pricing page are strong intent signals worth weighting heavily in your scoring model.
- Make follow-up persistent, not sporadic. Roughly six touches across calls, texts, and emails is a realistic benchmark before writing a lead off. Queue-based, next-best-lead routing keeps reps working the list systematically instead of cherry-picking the easy ones.
- Map nurture content to funnel stage. Top-of-funnel leads need education; middle-of-funnel leads need comparisons and proof; bottom-of-funnel leads need a reason to act now, like limited inventory or a rate incentive.
- Add personalization and social proof. A rep referencing the specific vehicle a lead viewed, or a testimonial relevant to that buyer's situation, converts better than a generic script.
- Fix the operational layer. Queue-based workflows, live dashboards, and regular rep coaching sessions turn a one-time fix into a repeatable system instead of a temporary bump.
Pro Tip: Test contact timing before assuming "instant" is always best. Some research shows a 10 to 60 minute window can outperform an under-5-minute call when the rep needs time to look up the lead's context and personalize the conversation.
What Should a Lead to Sale Conversion Dashboard Include?
A single top-line percentage tells you almost nothing about where leads are actually leaking. Instrument the stage-to-stage waterfall instead: how many leads move from raw inquiry to MQL, MQL to SQL, SQL to opportunity, and opportunity to closed deal, with drop-off and time-in-stage measured at each step.
- First-contact time (target: under 30 minutes for inbound)
- MQL-to-SQL rate, tracked by channel and lead source
- Opportunity-to-close rate, tracked by rep and by lead score tier
- Lead quality score distribution over time
| Stage | What to Track |
|---|---|
| Lead to MQL | Volume, source, and time-to-qualify |
| MQL to SQL | Conversion rate and drop-off reasons |
| SQL to Opportunity | Time-in-stage and rep assignment |
| Opportunity to Close | Win rate and average deal size |
Review this weekly at the team level and monthly at the leadership level. When you change something, whether it's an SLA, a scoring model, or a new nurture sequence, run it as a simple A/B or holdout test against a comparable cohort before rolling it out everywhere.
Why Is My Lead to Sale Conversion Rate Low?
Most low-conversion diagnoses trace back to one of a handful of causes.
- Mixed definitions. If marketing counts a form fill as a "lead" and sales counts only a qualified callback, your denominator is inflated and your rate looks worse than reality.
- Monthly snapshots on a long cycle. Comparing this month's leads to this month's sales when your cycle runs 60 to 90 days will always understate the true rate.
- Slow or inconsistent follow-up. Check your actual first-contact time against your SLA. A gap here is the single most common fix.
- Volume obsession. More unqualified leads dilutes the rate without adding revenue. Check cost per sale, not just cost per lead, as a corrective.
How Does an Independent Marketing Audit Improve Conversion?
In-house teams often can't see their own blind spots, especially when vendor reports conflict with each other. Autoroiq runs vendor-agnostic marketing intelligence for dealerships, meaning it doesn't sell advertising and has no stake in which channel gets credit for a sale.
- Uses closed-loop attribution and vendor scoring to catch channel mismatch and misattributed leads.
- Flags routing gaps and qualification errors that in-house teams rarely spot on their own.
Pro Tip: If your marketing and sales teams each report a different conversion number for the same month, that disagreement alone is a signal an independent review is worth running before you spend another dollar on new lead sources.
An independent audit makes the most sense once you've already tried the in-house fixes above and the number still won't move. That's usually when a hidden attribution error or a vendor overstating its contribution is the real culprit.
Our Take on What Actually Moves This Number
The conventional advice on lead-to-sale conversion spends too much time on formulas and not enough on the fact that most low rates are execution problems wearing a math disguise. Teams obsess over whether their rate is 2% or 3% while ignoring that leads sit untouched for hours because nobody owns the routing rule.
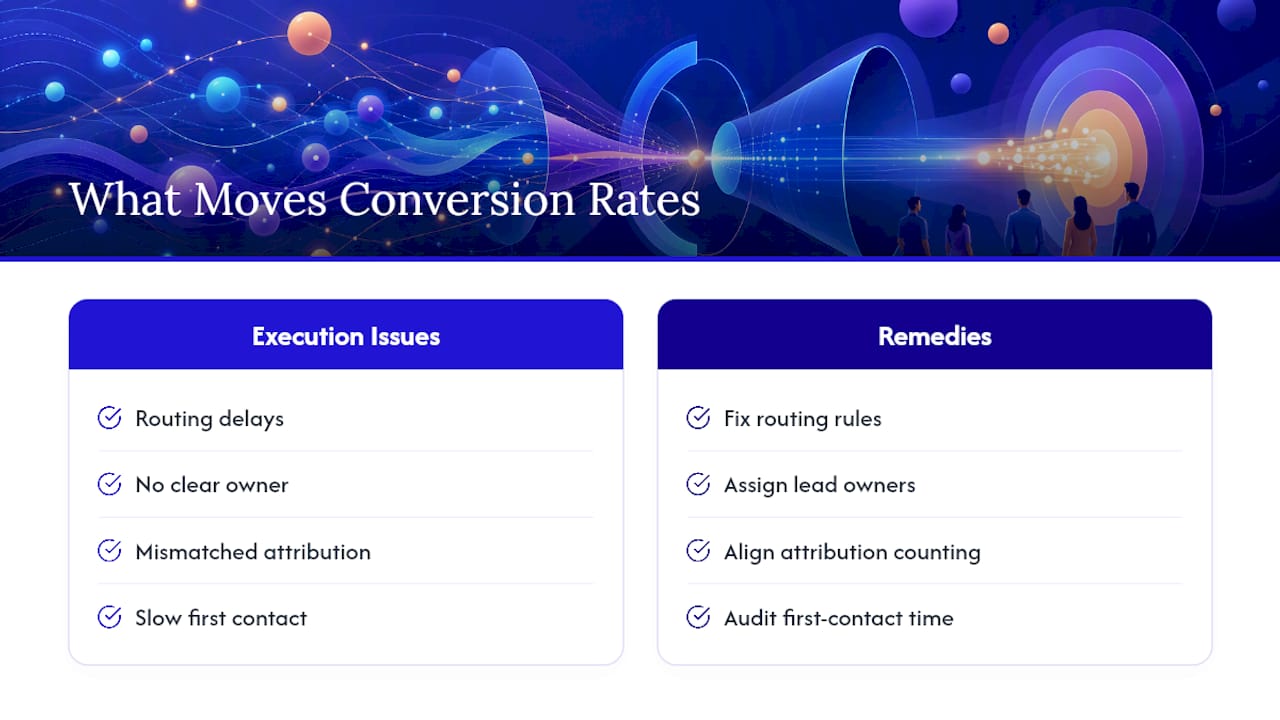
What's overrated: chasing a "good" benchmark number in isolation. What's underrated: the discipline of cohort measurement and the willingness to admit that marketing and sales are counting different things.
If we had to pick one place to start, it would not be a new nurture campaign or a bigger ad budget. It would be an honest audit of first-contact time and whether your two teams agree on what a "lead" even is. That disagreement, more than any channel mix problem, is usually the real ceiling on conversion. When the in-house fixes stall, that's the point where independent, vendor-agnostic analysis earns its cost.
— AutoROIQ
Sources
- What is lead to customer conversion rate?
- Sales conversion rate strategy
- How conversion funnels create a better customer journey + tips to optimize yours
- How to increase lead conversion