
Paid search ROI measures how much revenue or margin your ad spend generates relative to its cost. The single most important first step is not adjusting bids or rewriting ad copy. It is verifying that your tracking is connected to actual sales, not just form fills or website sessions. Without that connection, every optimization decision rests on incomplete data.
Two formulas anchor the entire discipline:
- ROAS = Revenue ÷ Ad Spend (a gross revenue ratio; fast to calculate, easy to benchmark)
- Marketing ROI (%) = (Revenue from Ads − Ad Spend) ÷ Ad Spend × 100 (margin-aware when you substitute gross profit for revenue)
ROAS tells you how many dollars came back for every dollar spent. Marketing ROI tells you whether that return actually covered costs and generated profit. For most dealerships and B2B advertisers, ROAS alone overstates performance because it ignores cost of goods and variable margin.
A Gartner survey found that digital channels now account for 61.1% of total marketing spend, which makes rigorous paid search measurement a budget priority, not a reporting nicety.
To get the most from this guide, you will need to work through five areas:
- Metrics: Which numbers actually connect to profitability
- Attribution and tracking: How to import offline conversions and connect your CRM or DMS to ad data
- Calculation: Formulas, worked examples, and sensitivity analysis
- Experiments: How to prove your ads caused sales, not just correlated with them
- Benchmarks: How to set realistic goals without being misled by cross-industry averages
Key Takeaways
Paid search ROI is only as reliable as the measurement connecting ad spend to verified sales, and margin-aware optimization decisions require offline conversion data flowing into the ad platform.
| Point | Details |
|---|---|
| Fix tracking first | Import offline conversions from your CRM or DMS before making any bid or budget changes. |
| Measure to revenue, not clicks | CPS and margin-aware ROAS are the metrics that reflect actual dealership profitability. |
| Segment brand from non-brand | Blended ROAS overstates performance; non-brand efficiency is the real growth signal. |
| Test for incrementality | Holdout experiments and geo tests are the only way to confirm ads caused sales, not just correlated with them. |
| Autoroiq for independent analysis | Autoroiq delivers vendor-agnostic paid search audits tied to verified sales data and margin-adjusted ROI. |
Table of Contents
- How paid search ROI is built from the metrics that matter
- How to calculate paid search ROI: formulas, ROAS, LTV:CAC, and a worked example
- Attribution models, conversion import, and measurement quality
- Tactics that directly improve paid search ROI
- Benchmarks, realistic goals, and the 4-Band approach to comparisons
- Testing plan and incrementality: how to prove your ads caused sales
- Tools and dashboards to measure paid search ROI end-to-end
- Common mistakes that make paid search ROI look better or worse than it really is
- Research-backed insight: outcome-based measurement and an automotive example
- Primary sources and further reading
- Sources
How paid search ROI is built from the metrics that matter
The Digital Marketing Institute identifies CPA, CTR, conversion rate, and customer lifetime value as the foundational inputs for ROAS and LTV:CAC calculations. Each metric serves a different steering purpose, and using the wrong one to make budget decisions is one of the most common sources of wasted spend.
Metric definitions and their business links
CPA (Cost Per Acquisition): Total ad spend divided by the number of conversions. Useful for acquisition efficiency, but misleading when conversions are defined as leads rather than sales.
ROAS (Return on Ad Spend): Revenue divided by ad spend. The standard efficiency ratio for campaign-level reporting. Becomes meaningful only when revenue is verified sales, not proxy events.
Marketing ROI (%): Profit (or gross margin) minus ad spend, divided by ad spend. The most honest measure of whether a campaign is worth running.
CTR (Click-Through Rate): Clicks divided by impressions. A signal of ad relevance and creative quality, not a revenue metric. High CTR with low conversion rate usually points to a landing page or audience mismatch.
Conversion Rate (CVR): Conversions divided by clicks. Directly affects CPA. A 1-percentage-point improvement in CVR often has more impact on ROI than a 20% reduction in CPC.
CPC (Cost Per Click): Driven by auction dynamics, quality score, and bid strategy. Lower CPC is not always better; a higher CPC on a high-intent keyword frequently delivers a lower CPA. Skai's overview of paid search auction mechanics explains why bid and quality score interact to set the actual price you pay.
Quality Score: Google's 1–10 rating of ad relevance, expected CTR, and landing page experience. A low quality score inflates CPC and reduces impression share, compressing ROI before a single optimization tactic is applied.
Impression Share: The percentage of eligible impressions your ads actually received. Lost impression share due to budget signals underinvestment; lost impression share due to rank signals a quality or bid problem.
LTV (Customer Lifetime Value): Total revenue a customer generates over their relationship with your business. For automotive dealers, this includes service revenue, repeat purchases, and referrals.
CAC (Customer Acquisition Cost): Total marketing and sales cost to acquire one customer. When CAC includes only ad spend, it understates the true cost.
LTV:CAC: The ratio of lifetime value to acquisition cost. A ratio above 3:1 is generally considered healthy for sustainable growth; below 1:1 means you are paying more to acquire customers than they return.
| Metric | Data Required | When to Prioritize |
|---|---|---|
| CPA | Ad spend, verified conversions | Acquisition efficiency; early-stage accounts |
| ROAS | Ad spend, verified revenue | Revenue steering; mid-to-mature accounts |
| Marketing ROI (%) | Ad spend, gross margin, revenue | Profitability decisions; budget allocation |
| LTV:CAC | LTV from CRM, total CAC | Long-term channel viability; retention-heavy businesses |
| Impression Share | Platform reporting | Competitive pressure; budget sufficiency |
| Quality Score | Platform reporting | CPC reduction; account health |
| CVR | Clicks, conversions | Landing page and audience diagnosis |
For acquisition-focused campaigns, CPA and CVR are the primary steering metrics. For revenue decisions, ROAS and marketing ROI take over. For long-term channel investment decisions, LTV:CAC is the number that matters most.
How to calculate paid search ROI: formulas, ROAS, LTV:CAC, and a worked example
The core formulas
ROAS = Revenue ÷ Ad Spend
Marketing ROI (%) = (Revenue − Ad Spend) ÷ Ad Spend × 100
CAC = Total Marketing and Sales Spend ÷ New Customers Acquired
LTV = Average Purchase Value × Purchase Frequency × Customer Lifespan
LTV:CAC = LTV ÷ CAC
Payback Window = CAC ÷ (Average Monthly Revenue per Customer × Gross Margin %)
Margin-Aware ROAS = (Revenue × Gross Margin %) ÷ Ad Spend
Margin-aware ROAS is the version that actually tells you whether a campaign is profitable. A standard ROAS of 4x on a product with 20% gross margin means you are breaking even, not thriving.
Worked example: automotive dealer importing offline sales
A dealership runs a Google Search campaign with the following data over 30 days:
- Ad spend: $18,000
- Clicks: 3,600
- Online leads (form fills): 180
- CRM-verified sales attributed to paid search: 9
- Average gross profit per vehicle: $3,200
Step 1: CPA (lead-based) $18,000 ÷ 180 = $100 per lead
Step 2: Cost Per Sale (CPS) after offline import $18,000 ÷ 9 = $2,000 per sale
Step 3: Revenue from ad-attributed sales 9 × $3,200 gross profit = $28,800
Step 4: Margin-Aware ROAS
Step 5: Marketing ROI (%) ($28,800 − $18,000) ÷ $18,000 × 100 = 60% ROI on gross margin**
The lead-based CPA of $100 looked healthy. DealerSmart's benchmark guidance provides practical CPS ranges after offline import that dealers can use as directional targets.
Sensitivity table: how changes in CVR, gross profit, and margin affect ROI
| Scenario | CVR Change | Avg. Gross Profit | CPS | Margin-Aware ROAS | ROI (%) |
|---|---|---|---|---|---|
| Baseline | 5% (leads to sales) | $3,200 | $2,000 | 1.6x | 60% |
| CVR improves to 7% | +2pp | $3,200 | $1,429 | 2.2x | 124% |
| Gross profit drops to $2,400 | No change | $2,400 | $2,000 | 1.2x | 20% |
| Both improve | +2pp CVR, $3,600 GP | $3,600 | $1,429 | 2.5x | 152% |
That is where most dealers have the most leverage.
A note on time windows: Monthly snapshots can mislead when sales cycles are long. Cohort-based calculations, where you track the revenue generated by leads acquired in a specific period through their full close cycle, give a more accurate picture. For automotive, a 60–90 day attribution window is typically more honest than a 30-day cut.
Attribution models, conversion import, and measurement quality
Attribution is where most paid search ROI analyses break down. The model you choose changes which campaigns get credit for sales, which changes bid optimization signals, which changes where budget flows.
Comparing attribution models
| Model | How Credit Is Assigned | Best Used When |
|---|---|---|
| Last-click | 100% to the final ad click before conversion | Short, single-touch purchase cycles |
| First-click | 100% to the first ad click in the path | Awareness-stage budget decisions |
| Linear | Equal credit across all touchpoints | Understanding full-funnel contribution |
| Time-decay | More credit to clicks closer to conversion | Long consideration cycles with multiple touches |
| Data-driven (multi-touch) | Algorithmic, based on actual conversion paths | High-volume accounts with sufficient conversion data |
Data-driven attribution is generally the most accurate model for mature accounts with enough conversion volume. For most dealerships, the practical barrier is data volume: Google recommends at least 300 conversions per month in the conversion action for data-driven to be reliable. Below that threshold, time-decay or linear models are more defensible than last-click.
Measurement implementation checklist
- Google Ads conversion tag or GA4 event firing correctly on all conversion actions
- GA4 property linked to Google Ads with auto-tagging enabled
- Offline conversion import configured: CRM or DMS exports matched to GCLID (Google Click ID)
- Phone call tracking integrated (call extensions, call-only ads, website call tracking)
- De-duplication rules set so the same sale is not counted as both an online lead and an offline conversion
- Cross-device tracking reviewed; logged-in user data or enhanced conversions enabled where possible
- Server-side tagging considered for environments where browser-side tags are blocked
Importing offline conversions is the single highest-leverage measurement step for dealers. When a lead submits a form, gets called by BDC, and buys three days later, that sale is invisible to Google Ads without an offline import. The Incremys paid search audit guide recommends starting every audit with measurement reliability and revenue import before touching bids or budgets.
Tracking breaks silently. A campaign that appears to be underperforming may simply have lost its conversion signal, and you could cut budget from a campaign that is actually working.*
Tactics that directly improve paid search ROI
Not all optimizations move ROI equally. The list below is ordered by typical impact-to-effort ratio, with notes on which account stage benefits most.
1. Fix measurement before anything else
No optimization is reliable without accurate data. Import offline conversions, de-duplicate leads, and confirm your attribution model before changing bids. This applies to every account at every stage.
2. Negative keyword expansion
For early-stage and mid-maturity accounts, negative keywords often deliver the fastest CPA improvement. Irrelevant queries burn budget without generating qualified traffic.
3. Brand vs. non-brand segmentation
Brand terms almost always show a lower CPA and higher ROAS than non-brand terms. Blending them into a single campaign or report inflates apparent performance. Segment them, report them separately, and set different ROAS targets for each. Non-brand performance is the real measure of paid search's ability to grow your business.
4. Match type discipline
Broad match can expand reach efficiently when paired with Smart Bidding and strong audience signals, but it requires active search term monitoring. Phrase and exact match give tighter control at the cost of reach. For accounts with limited conversion data, starting with phrase and exact match reduces noise while the algorithm learns.
5. Bid strategy alignment to the right conversion action
Bidding to maximize clicks or minimize CPC optimizes for the wrong outcome. Target CPA bidding works when you have sufficient conversion volume. Target ROAS bidding requires revenue data in the conversion action. For dealers who have imported offline sales, bidding to a target CPS (cost per sale) is the most direct path to margin-aware efficiency.
6. Landing page improvements
Landing page quality affects both Quality Score (which reduces CPC) and conversion rate (which reduces CPA). A page that loads in under 2.5 seconds, matches the ad's specific offer, and has a single clear call to action consistently outperforms generic inventory pages. For automotive, VDP (Vehicle Detail Page) traffic with model-specific ad copy typically converts better than traffic sent to a general search results page.
7. Audience layering
Layering in-market audiences, customer match lists, and remarketing audiences onto search campaigns allows bid adjustments by segment. Returning visitors who previously viewed a VDP convert at a higher rate than cold traffic. Adjusting bids upward for high-intent segments improves overall campaign ROAS without requiring more budget.
8. Budget reallocation by profitability segment
Mature accounts benefit most from shifting budget toward campaigns, ad groups, or keywords with the best margin-adjusted ROAS. This requires CPS or margin data at the campaign level, which is only possible after offline conversion import. Without it, budget allocation decisions are based on lead volume, not profit.
For cross-channel context on where paid search fits relative to other digital channels, the Facebook Ads vs. Google guide for dealerships covers how to prioritize budget across platforms based on intent and funnel stage.
Benchmarks, realistic goals, and the 4-Band approach to comparisons
Benchmarks are useful guardrails, not hard thresholds. A ROAS that looks strong in one market segment can be mediocre in another with different margin profiles or competitive density. The most common benchmarking mistake is comparing your account to a cross-industry average that includes e-commerce, SaaS, and retail alongside automotive.
APQC's marketing benchmark guidance for automotive organizations supports the principle that sector-specific peer comparisons are more actionable than blended averages. The same logic applies at the dealership level: a high-volume franchise dealer in a metro market should not benchmark against a rural independent.
Rules for meaningful benchmarking
- Compare within the same product type (new vehicle vs. used vs. service)
- Segment by funnel stage (awareness vs. consideration vs. in-market)
- Account for margin differences across vehicle segments
- Use geography-adjusted benchmarks when possible (metro vs. rural CPCs differ significantly)
- Separate brand from non-brand before any comparison
The 4-Band approach
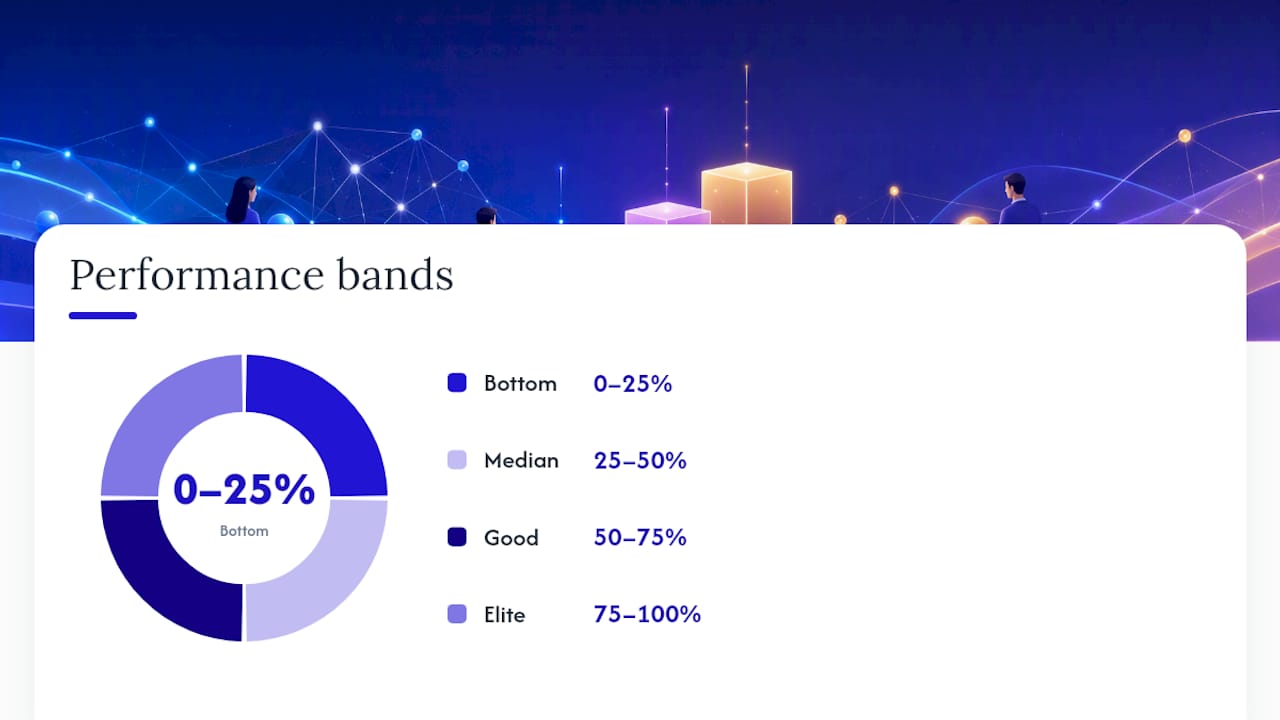
Rather than a single benchmark number, a 4-Band framework maps your account's performance into one of four tiers, which directly informs where to focus:
| Band | Description | Priority Action |
|---|---|---|
| Bottom (0–25th percentile) | Significant measurement or structural gaps | Fix tracking, segment brand/non-brand, audit negatives |
| Median (25th–50th percentile) | Functional but underoptimized | Improve landing pages, tighten match types, import offline conversions |
| Good (50th–75th percentile) | Competitive performance | Audience layering, bid strategy refinement, incrementality testing |
| Elite (75th–100th percentile) | Top-tier efficiency | Margin-aware bidding, LTV-based targeting, experiment-driven scaling |
Most accounts that have not imported offline conversions are operating in the Bottom or Median band on CPS even when their lead-based CPA looks healthy. The DealerSmart benchmark guide provides directional CPA and CPS ranges that help dealers locate themselves within these bands.
Pro Tip: Build internal cohorts by month of lead acquisition and track their close rates over 90 days. After six months of this data, you will have a proprietary benchmark that is more relevant to your market than any published industry average.
Testing plan and incrementality: how to prove your ads caused sales
Correlation is not causation. A spike in sales during a campaign flight does not prove the campaign drove those sales. Incrementality testing answers the question that ROAS cannot: would those customers have bought anyway?
A practical testing playbook
Step 1: Define the hypothesis and success metric before launching. Pre-register your expected direction and minimum detectable effect. If you are testing a new bid strategy, define what CPS improvement would justify a full rollout.
Step 2: Choose the right test method for your traffic volume.
- Holdout tests (ghost bidding): Google Ads Campaign Experiments can suppress ads for a randomly selected audience segment. The holdout group shows what would have happened without the ads.
- Geo experiments: Split markets into test and control geographies. Useful for budget-level decisions and channel comparisons. Requires similar market profiles between groups.
- Randomized control trials (RCTs): The gold standard for incrementality. Requires sufficient volume and careful contamination controls.
- Conversion lift studies: Available within Google Ads for search and display. Measures the incremental conversion rate of users exposed to ads versus a holdout group.
Step 3: Estimate required test duration. Minimum sample guidance: aim for at least 100 conversions per variant before reading results. For a campaign generating 20 sales per month, a meaningful test requires at least 5 months per variant. Rushing the read is the most common testing mistake.
Step 4: Guard against statistical pitfalls.
- Peeking: Reading results before the pre-set end date inflates false-positive rates. Set the analysis window in advance and do not check results early.
- Seasonal confounds: A test that runs across a model-year changeover or a major sales event is contaminated. Control for seasonality by running tests in stable periods or by using year-over-year comparisons.
- Selection bias: Holdout groups must be randomly assigned, not self-selected. Campaigns that only show to users who already searched for your brand will show inflated lift.
- Contamination: In geo experiments, markets that share media (overlapping DMAs, cross-border commuters) bleed treatment into control. Choose geographically isolated test markets.
Step 5: Use results to reallocate budget. A statistically significant lift result gives you a defensible basis to scale the winning variant. Document the test parameters, results, and decision criteria so the logic is auditable. For creative-level testing, the ad creative testing playbook covers how to structure experiments at the ad level with proper controls.
Tools and dashboards to measure paid search ROI end-to-end
The right technical stack connects ad spend to verified revenue at every stage of the funnel. No single platform does this out of the box for automotive dealers; it requires deliberate integration.
Recommended stack by function
- Ad platforms: Google Ads, Microsoft Advertising (for search campaign management, bid automation, and conversion import)
- Analytics: GA4 (session-level data, audience building, conversion tracking, and Google Ads integration)
- CRM/DMS integration: Export GCLID-matched sales records from your CRM or DMS to Google Ads offline conversion import. Keyloop's guidance on connecting CRM data to campaign reporting explains why this step is the difference between reporting and performance management.
- Call tracking: CallRail, Invoca, or similar platforms that capture call conversions and attribute them to the originating keyword and campaign
- Server-side tagging: Google Tag Manager server-side container or a similar solution to improve data accuracy in cookie-restricted environments
- Attribution platforms: For multi-channel analysis beyond Google's own reporting, platforms in the marketing mix modeling or multi-touch attribution category provide cross-channel views
For a detailed comparison of analytics platforms for dealer environments, the GA4 vs. Adobe Analytics guide covers the tradeoffs relevant to dealership reporting.
Dashboard structure: from spend to margin-adjusted ROI
| Dashboard Layer | Metrics Shown | Data Source |
|---|---|---|
| Spend and efficiency | Ad spend, CPC, CTR, impression share | Google Ads / Microsoft Ads |
| Conversion performance | Leads, CVR, CPA (lead-based) | GA4 + ad platform |
| Sales attribution | CPS, offline conversions, close rate | CRM/DMS export + offline import |
| Revenue and margin | Gross profit per sale, margin-aware ROAS, ROI (%) | DMS + ad platform |
| Segment view | Brand vs. non-brand, campaign, geography | Combined data layer |
Data governance notes
- Reconcile ad platform spend against CRM-attributed sales weekly, not monthly. Monthly reconciliation lets tracking errors compound.
- Set automated alerts for conversion volume drops (greater than 20% week-over-week) and for CPA spikes (greater than 30% above the 30-day average).
- Document the conversion actions in use, their definitions, and the de-duplication rules. When team members change, undocumented conversion setups become a source of silent measurement drift.
Common mistakes that make paid search ROI look better or worse than it really is
Measurement errors do not announce themselves. They show up as suspiciously good ROAS, inexplicably low CPA, or a persistent gap between ad-reported leads and CRM-recorded sales.
The most common pitfalls
-
Relying on last-click without offline import: Last-click attribution credits the final online touchpoint, which is often a branded search or a retargeting click. It overstates the contribution of lower-funnel campaigns and understates awareness and consideration campaigns. Without offline sales data, the conversion action being optimized is a proxy, not a business outcome.
-
Double-counting conversions: A lead that submits a form and then calls the dealership can be counted twice if both events fire as separate conversion actions without de-duplication. This deflates CPA artificially and sends the wrong signal to Smart Bidding.
-
Ignoring margin: A campaign with a 6x ROAS on a vehicle with 8% gross margin is less profitable than a campaign with a 3x ROAS on a vehicle with 20% gross margin. Reporting gross revenue ROAS without margin context produces misleading budget decisions.
-
Failing to segment brand vs. non-brand: Brand keywords convert at high rates because users are already intent-driven. Blending brand and non-brand performance into a single ROAS figure makes non-brand campaigns look better than they are and masks underperformance.
-
Not de-duplicating leads: When the same prospect submits multiple forms across multiple visits, each submission may count as a separate conversion. CPA drops, but no additional sales are generated.
-
Misinterpreting correlation as causation: Sales often spike during periods when ad spend also increases, but external factors (seasonal demand, manufacturer incentives, competitor closures) can drive both. Without a holdout or geo experiment, you cannot separate the ad effect from the market effect.
Red flags in reporting and corrective steps
-
Sudden CPA drop with no tactical change: Check for duplicate conversion tags, a new conversion action firing on a low-value event, or a tracking configuration change. Do not celebrate a CPA drop you cannot explain.
-
Mismatch between ad-reported leads and CRM sales: If your ad platform reports 200 leads and your CRM shows 40 sales-qualified contacts from paid search, the gap is either attribution (different windows), lead quality (low-intent traffic), or data plumbing (form submissions not syncing). Investigate before optimizing.
-
Unusually high ROAS on brand terms: Brand ROAS is almost always high. If brand campaigns are consuming a large share of budget and driving the overall account ROAS, non-brand efficiency may be much weaker than the blended number suggests. Separate the reporting and set independent targets.
For a broader diagnostic checklist, the 10 signs your dealership is wasting marketing dollars covers the most common budget leakage patterns across channels.
Research-backed insight: outcome-based measurement and an automotive example
The most significant shift in automotive paid search measurement over the past several years is the move from proxy metrics to verified sales as the optimization signal. Clicks, leads, and VDP views are easy to measure but weakly correlated with actual vehicle sales. When campaigns optimize to these proxies, they get better at generating proxies, not at selling cars.
An industry paper summarized by Digital Dealer describes an outcome-based approach that anchors advertising optimization to daily verified sales data. The reported Toyota case is the clearest illustration of what this shift produces: optimizing to sales rather than online proxies reduced cost per sale by approximately two-thirds and generated an offline ROAS exceeding $600.
That figure is not a benchmark to chase. It reflects a specific market, vehicle segment, and campaign configuration. What it demonstrates is the order-of-magnitude difference between optimizing to a proxy and optimizing to the actual business outcome.
Implementation steps for outcome-based measurement
- Data plumbing: Establish a daily or near-daily export from your DMS of sales records with GCLID or other ad-click identifiers. The match rate between ad clicks and sales records is the first number to track.
- Identity resolution: Customers often interact with ads on one device and complete the purchase on another, or in-store. Enhanced conversions, customer match, and CRM-based identity resolution improve the match rate.
- Experiment planning: Once sales data flows into the ad platform, run a holdout experiment to measure the incremental lift. The baseline is what sales would have been without paid search, not what the ad platform reports.
- Integration cadence: Daily data imports allow bid algorithms to optimize within the same week. Weekly imports introduce lag that reduces the quality of automated bidding signals.
The practical value of this approach is not just efficiency. When campaigns optimize to verified sales, budget naturally flows toward the segments, geographies, and vehicle types that actually close. Campaigns that generate high lead volume but low close rates lose budget share automatically, without manual intervention.
How Autoroiq approaches paid search ROI analyses
At Autoroiq, every engagement starts with a data-first audit of measurement reliability before any optimization recommendation is made. The sequence matters: if the conversion data flowing into the ad platform does not reflect verified sales, every downstream recommendation is built on a flawed foundation.
The diagnostic process covers four areas:
- Measurement audit: Confirm conversion tags, de-duplication rules, offline import configuration, and attribution model selection
- Revenue import: Connect DMS or CRM sales records to ad platform data and calculate CPS and margin-aware ROAS at the campaign level
- Prioritized roadmap: Rank optimization opportunities by expected impact on CPS and ROI, with clear decision thresholds for each action
- Validation criteria: Define what a successful outcome looks like before any change is made, so results are auditable and defensible
Quick wins from this process typically include identifying double-counted conversions, surfacing brand/non-brand blending that inflates reported ROAS, and finding campaigns that generate high lead volume but low close rates. The roadmap that follows gives dealership leaders a clear, prioritized set of actions tied to expected CPS improvement, not just directional advice.
If you want to run a measurement health check on your paid search account, that is a practical starting point for any engagement.
Autoroiq's independent marketing intelligence for dealerships
Most dealerships receive paid search performance reports from the same vendors running their campaigns. That structure creates a conflict: the vendor's report reflects the vendor's optimization goals, which may not align with the dealership's margin and profitability targets.

Autoroiq provides independent marketing performance analysis for automotive dealerships, with no media sales and no vendor relationships that create bias. For paid search specifically, that means an offline-conversion-connected ROI analysis, a vendor scorecard that holds campaign performance to CPS and margin-aware ROAS standards, and an ongoing advisory relationship that keeps measurement governance current as platforms and tracking environments change.
The result is a clear, defensible picture of where paid search spend is generating profit and where it is not, delivered in a format dealership executives can act on without needing to interpret platform-native reports.
To request a diagnostic engagement, visit Autoroiq's marketing intelligence services and describe your current measurement setup. The first conversation focuses on what data you already have and what gaps need to be closed before optimization begins.
Primary sources and further reading
The sources below back the methods, formulas, and case examples in this article. Each is worth consulting directly for deeper methodology or to validate benchmark figures against your own account data.
-
Digital Dealer — Automotive advertising pivots to outcome-based measurement: Covers the shift from proxy metrics to verified sales optimization, including the Toyota case study on cost per sale reduction and offline ROAS.
-
DealerSmart — Dealership benchmarks for Google Ads (CPA, CVR, CPS): Practical directional ranges for search CPA, conversion rate, and cost per sale after offline import; useful for locating your account within the 4-Band framework.
-
Incremys — Paid Search Audit: SEA guide: Structured audit methodology that prioritizes measurement reliability and revenue import before optimization; the recommended starting point for any account review.
-
Gartner — Digital channels share of marketing spend: Survey data showing digital channels at 61.1% of total marketing spend; context for why paid search measurement is a budget-level priority.
-
APQC — Marketing key benchmarks (automotive): Process-group benchmarks for automotive marketing organizations; supports the case for peer-based rather than cross-industry benchmark comparisons.
-
Keyloop — How to measure marketing ROI in automotive retail: Explains the importance of connecting CRM and DMS data to campaign reporting for true revenue attribution.
-
ResearchGate — Pay Per Click and Paid Search: Cost-Effectiveness and ROI in Digital Marketing: Academic analysis of PPC cost-effectiveness and ROI methodologies; useful for teams validating calculation approaches against published research.
Sources
- Gartner press release — digital channels share of marketing spend
- Digital Marketing Institute — How to measure the ROI of paid advertising