
The advertising-to-sales ratio (A/S ratio) equals total advertising spend divided by total sales revenue, expressed as a percentage. Compute it now, compare it to your industry benchmark and your own prior periods, and you have an immediate read on whether your ad budget is proportionate to the revenue it supports.
Formula: A/S Ratio = (Total Advertising Spend ÷ Total Sales Revenue) × 100
The standard industry term is the advertising-to-sales ratio, sometimes written as the A/S ratio or ad-to-sales ratio. Across a sample of more than 2,500 publicly traded companies and 315 industries, the cross-industry average landed near 3.07%, which gives you a rough anchor before you pull your own sector's data.
Two actions to take right now:
- Pull your total ad spend and total sales revenue for the last full month or quarter.
- Divide spend by revenue, multiply by 100, and compare the result to your industry average and your own prior-period trend.
Key Takeaways
The advertising-to-sales ratio is a reliable budget control metric only when spend and revenue are defined consistently and compared against both industry benchmarks and your own trend data.
| Point | Details |
|---|---|
| Core formula | A/S Ratio = (Ad Spend ÷ Sales Revenue) × 100; compare to your prior periods and sector benchmarks. |
| Cross-industry average | A sample of 2,500+ public companies averaged a 3.07% A/S ratio; your sector may differ significantly. |
| Interpret with context | A high ratio can mean overspend or a growth phase; always check margin and revenue trend before acting. |
| Pair with MER and CPS | Use MER for blended top-line steering and CPS for campaign-level accountability alongside the A/S ratio. |
| Autoroiq for dealers | Autoroiq normalizes vendor spend and reconciles CRM sales to deliver a defensible, vendor-agnostic A/S analysis. |
Table of Contents
- What the advertising-to-sales ratio actually measures
- How to calculate the ratio accurately: formula, scope, and timeframe
- A worked example: calculating and reading your number
- How to read a high or low ratio and avoid false conclusions
- Industry benchmarks and typical A/S ranges for U.S. sectors
- How the A/S ratio relates to MER, ROAS, CPS, and CAC
- A step-by-step process for using the ratio to set budgets and improve efficiency
- How automotive dealerships should apply the A/S ratio
- The A/S ratio is a steering metric, not a verdict
- Autoroiq's independent A/S analysis for dealerships
- Sources
What the advertising-to-sales ratio actually measures
The A/S ratio shows what share of revenue you are spending to generate that revenue through advertising. Think of it as a control metric: it does not tell you which ad drove which sale, but it tells you whether your advertising budget is growing faster or slower than your revenue. According to Investopedia's definition, a lower ratio generally signals higher advertising efficiency, though that reading only holds when compared within the same industry context.
Primary uses:
- Budget control: flag when ad spend is outpacing revenue growth
- Cross-period tracking: spot efficiency trends quarter over quarter
- Industry benchmarking: compare your ratio to sector peers
- Campaign sanity checks: verify that a channel's spend is proportionate to its attributed revenue
Limitations to keep in mind:
- The ratio does not prove causation. High sales during a period of heavy advertising does not confirm the ads drove those sales.
- Attribution noise is real. Platform-reported conversions routinely overlap, inflating apparent ad-driven revenue.
- The ratio is blended by default. A single company-wide figure masks channel-level inefficiencies.
Use the A/S ratio alongside attribution modeling and controlled experiments, not as a standalone verdict on advertising effectiveness.
How to calculate the ratio accurately: formula, scope, and timeframe
The formula is straightforward. What trips up most analysts is inconsistent definitions of "spend" and "revenue."
The formula:
A/S Ratio (%) = (Total Advertising Spend ÷ Total Sales Revenue) × 100
The Corporate Finance Institute's calculation checklist recommends pulling advertising expenses directly from the income statement and applying a consistent revenue definition every period.
What to include in advertising spend:
- Paid media buys (search, social, display, video, broadcast)
- Creative production costs tied to specific campaigns
- Agency and management fees
- Influencer and sponsorship payouts
- Promotional content distribution costs
What to exclude or decide deliberately:
- Salaries for in-house marketing staff (many companies exclude these; some include them for a fully-loaded view — pick one and hold it)
- Fixed overhead not tied to specific campaigns
- PR and earned media (these are not paid advertising)
Revenue scope choices:
- Gross vs. net revenue: net is more conservative and more accurate for margin analysis
- Returns and refunds: subtract them for a clean denominator
- Channel-reconciled revenue: use CRM-confirmed sales, not platform-attributed conversions, to avoid double-counting
Calculation checklist:
- Define your reporting window (monthly, quarterly, or campaign-specific) and hold it constant.
- Pull total advertising spend from the income statement using your agreed inclusions.
- Pull total sales revenue using your agreed definition (gross or net, returns excluded).
- Divide spend by revenue and multiply by 100.
- Record the result alongside the prior period and the relevant industry benchmark.
- Flag any period where spend or revenue definitions changed.
Segmenting by channel and by product line gives you a more precise read than a single blended figure, especially when one channel is in a growth phase and another is mature.
A worked example: calculating and reading your number
A mid-size dealership group spends $180,000 on advertising in a given month and records $4,500,000 in vehicle sales revenue for the same period.
A/S Ratio = ($180,000 ÷ $4,500,000) × 100 = 4.0%
At 4.0%, this dealership is spending $4 for every $100 of revenue on advertising. Compared to the cross-industry average near 3.07%, the ratio sits modestly above average. For automotive retail, where competitive local advertising is heavy, this is not alarming, but it warrants a trend check: if this figure was 2.8% six months ago and has been climbing, that trajectory matters more than the single data point. See how car video marketing can enhance sales trends in premium auto retail.
The next step is not to cut spend. It is to ask whether revenue is growing at the same pace as spend, and whether margin on those sales supports the current ratio.
How to read a high or low ratio and avoid false conclusions
A single number is rarely self-explanatory. Context determines whether your ratio signals a problem or a deliberate investment.
A high A/S ratio can mean:
- Overspending relative to revenue, especially if margins are thin
- A launch or growth phase where spend is intentionally front-loaded
- Low advertising efficiency at the channel or creative level
- Revenue recognition lag (spend hit this period; sales close next period)
A low A/S ratio can mean:
- High advertising efficiency and strong organic or repeat demand
- Underinvestment that is suppressing growth
- A declining market where revenue is falling faster than spend is being cut
Contextual checks before drawing conclusions:
- Trend direction: is the ratio rising, falling, or stable over the last four to six periods?
- Margin impact: does the revenue this spend supports carry enough contribution margin to justify the cost?
- Seasonality: automotive retail, retail, and consumer goods all have predictable high-spend periods
- Product lifecycle: a new model launch or market entry will naturally push the ratio higher
- Attribution noise: platform-reported revenue often exceeds CRM-confirmed sales, which artificially lowers the apparent ratio
Pro Tip: Before changing your budget based on the A/S ratio alone, pull contribution margin and revenue growth trend data for the same periods. A rising ratio paired with rising margin and revenue is a very different situation than a rising ratio with flat revenue.
Financial analysts consistently note that a "good" A/S ratio is context-dependent: a low ratio can signal efficient advertising or underinvestment, and only the revenue trend and margin data can tell you which. The Corporate Finance Institute makes this point directly in its ratio guidance.
Industry benchmarks and typical A/S ranges for U.S. sectors
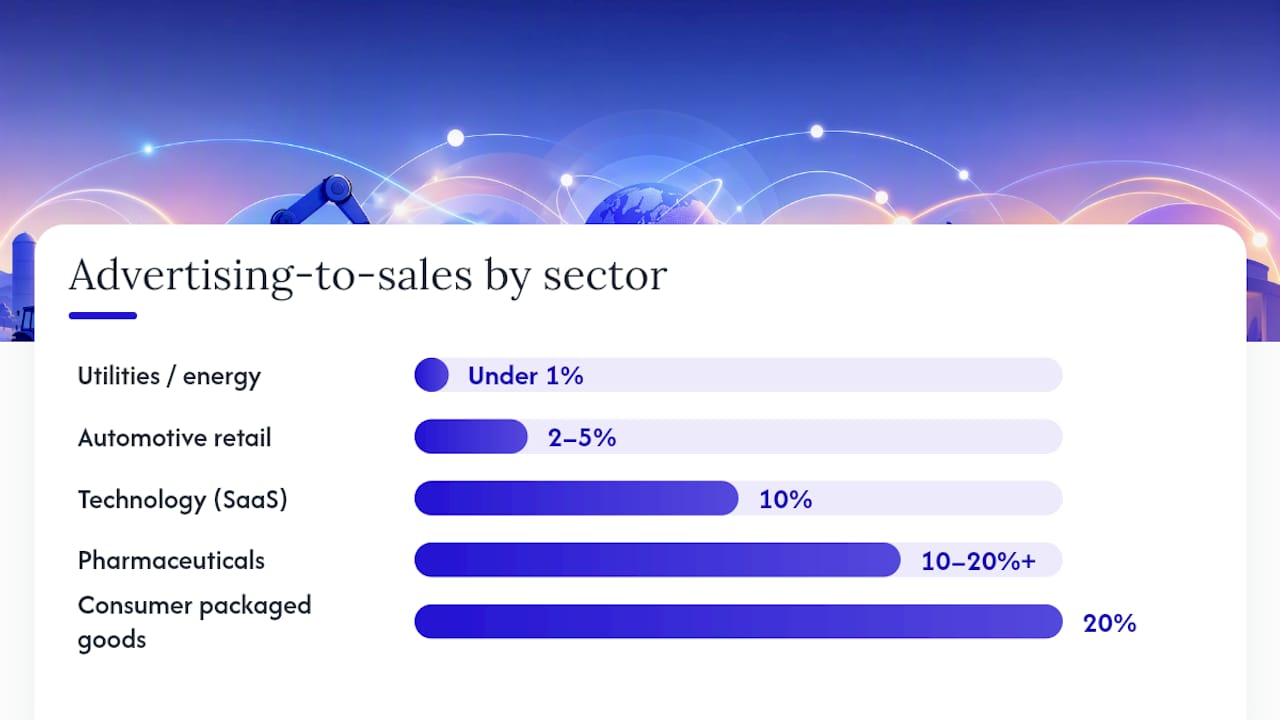
No universal target exists. Academic research confirms that the optimal A/S ratio varies with price elasticity, marginal profit, and competitive intensity. The table below shows illustrative ranges for U.S. sectors based on publicly available industry analyses. Use these as orientation, not hard targets.
| Sector | Typical A/S Range (%) | Notes |
|---|---|---|
| Consumer packaged goods | 20% | High competition, brand-driven |
| Retail (general) | 3% | Varies by channel mix |
| Automotive retail | 2–5% | Local media-heavy; CRM reconciliation critical |
| Pharmaceuticals | 10–20%+ | DTC advertising regulations vary |
| Financial services | 3% | Compliance constraints limit some channels |
| Technology (SaaS) | 10% | Growth-stage companies trend higher |
| Utilities / energy | Under 1% | Low advertising dependency |
Source: illustrative ranges drawn from cross-industry analyses; verify against current industry reports for your specific segment.
Startups and consumer-directed categories consistently trend toward the higher end. Established brands in low-advertising sectors sit well below the 3.07% cross-industry average. Practical guidance from Attherate notes that startups in growth phases often run significantly higher advertising-to-sales ratios, which is expected and planned rather than a warning sign.
For precise benchmarking, consult Schonfeld & Associates' annual Advertising Ratios & Budgets report and the CMO Survey published by Duke University's Fuqua School of Business. Both use consistent definitions and segment by industry and firm size.
How the A/S ratio relates to MER, ROAS, CPS, and CAC
The A/S ratio is a blended, top-line control metric. It works best alongside more granular metrics that answer different questions.
MER (Marketing Efficiency Ratio): Total revenue ÷ total marketing spend. HubSpot's MER guide describes it as a blended top-line view that complements channel-level ROAS. MER avoids attribution double-counting because it uses total revenue and total spend with no channel allocation required. Break-even MER = 1 ÷ contribution margin, which means the right MER target depends entirely on your margin profile, not a universal number.
ROAS (Return on Ad Spend): Revenue attributed to a campaign ÷ campaign spend. Channel-specific and attribution-dependent. Useful for allocating budget across channels; unreliable as a company-wide efficiency measure because platform attribution inflates results.
CPS (Cost Per Sale): Total campaign cost ÷ number of sales attributed to that campaign. AppsFlyer's CPS definition frames it as a campaign-level performance metric, useful for comparing creative executions or audience segments within a single channel. Pair it with A/S to connect campaign-level efficiency to company-level spend proportion.
CAC (Customer Acquisition Cost): Total sales and marketing spend ÷ new customers acquired. Broader than CPS; includes non-advertising costs and is most useful for subscription or repeat-purchase businesses evaluating lifetime value.
| Metric | Formula | Scope | Best For | Blind Spot |
|---|---|---|---|---|
| A/S Ratio | Ad spend ÷ revenue | Blended | Budget control, benchmarking | No channel detail |
| MER | Total revenue ÷ total marketing spend | Blended | Executive steering | Hides channel mix |
| ROAS | Attributed revenue ÷ campaign spend | Channel-level | Channel allocation | Attribution inflation |
| CPS | Campaign cost ÷ attributed sales | Campaign-level | Creative/audience testing | Ignores blended efficiency |
| CAC | Total S&M spend ÷ new customers | Company-wide | LTV modeling | Excludes retention spend |
For dealership executives, MER and A/S ratio together give a cleaner picture than ROAS alone, which vendors routinely report at inflated levels due to overlapping attribution windows.
A step-by-step process for using the ratio to set budgets and improve efficiency
Calculating the ratio once is a data point. Tracking it systematically is a management tool.
- Establish a consistent baseline. Lock in your spend and revenue definitions before your first calculation. Document what is included and excluded. Use CRM-confirmed sales, not platform-attributed conversions.
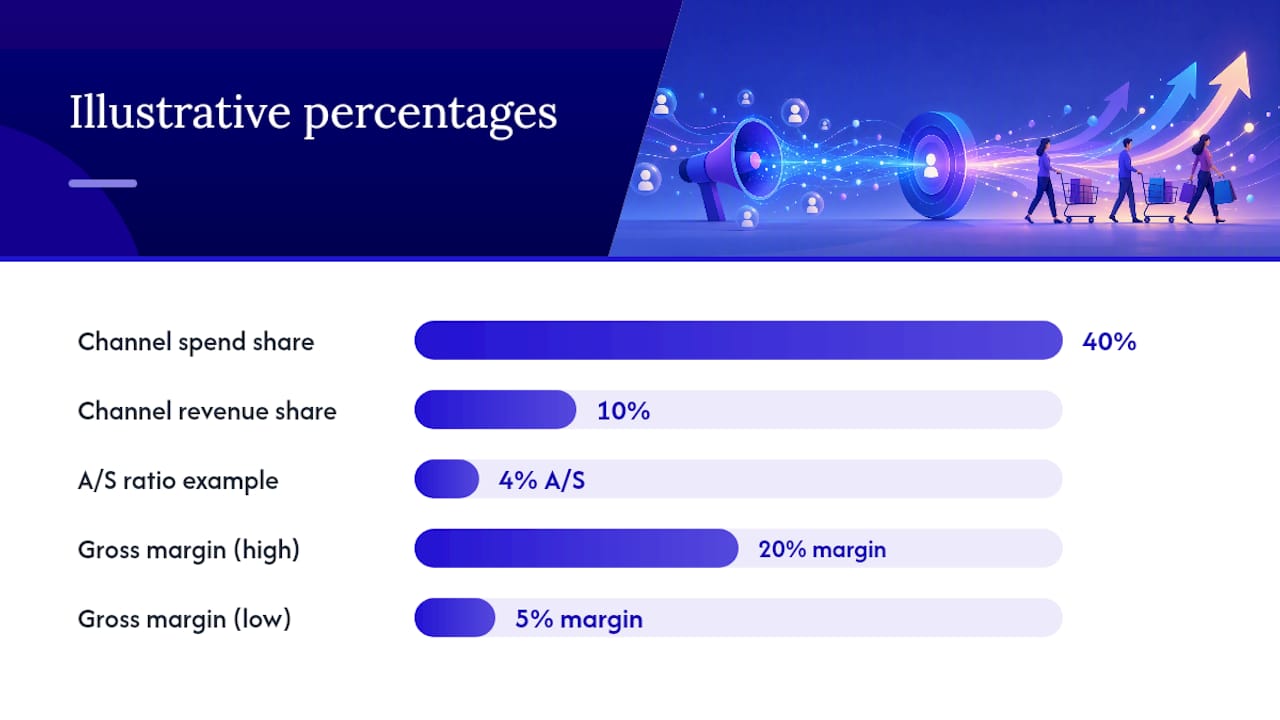
- Segment by channel and product line. A blended ratio can hide a channel that is consuming 40% of spend while contributing 10% of revenue. Segmenting Facebook and Google spend separately is a practical starting point for most dealerships.
- Compare to benchmarks and your own trend. Plot the ratio for the last six to twelve periods. A rising trend matters more than a single high reading.
- Test reallocations before committing. If the ratio signals overspend in one channel, run a controlled reduction for four to six weeks before cutting permanently. Track revenue impact alongside the ratio change.
- Apply margin-adjusted break-even thinking. A 4% A/S ratio on a 20% gross margin vehicle sale is a very different proposition than a 4% ratio on a 5% margin product. Calculate whether the revenue each channel supports covers its spend at current margins.
- Monitor at the right cadence. Activation teams benefit from weekly tracking. Finance and strategy reviews should use monthly or quarterly aggregates to avoid reacting to noise.
Pro Tip: Data hygiene is the most underrated part of this process. If your revenue definition changes mid-year (e.g., switching from gross to net, or adding a new CRM), restate prior periods before comparing trends. An apparent efficiency gain that is actually a definition change will lead to the wrong budget decision.
If your analytics setup needs a review before you can trust the revenue inputs, the GA4 vs. Adobe Analytics guide for dealerships covers the key reconciliation considerations.
How automotive dealerships should apply the A/S ratio
Dealerships face a specific challenge: multiple vendors each report their own attributed revenue, and those figures routinely overlap. A dealer spending $150,000 per month across search, social, and display may see vendor-reported attributed revenue that totals far more than actual CRM-confirmed sales. When that inflated number goes into the denominator, the A/S ratio looks artificially low, and the efficiency signal is wrong.
The correct approach is to use CRM-confirmed unit sales and gross revenue as the denominator, not platform-attributed revenue. Autoroiq normalizes spend lines across vendors and reconciles platform-reported figures against CRM data before computing the ratio, which is the only way to get a defensible number.
What dealers should ask every vendor before using their data in an A/S calculation:
- What exact spend line items are included in your reported cost figure?
- What attribution window are you using, and does it overlap with other active channels?
- Are any credits, bonuses, or co-op funds netted out of the reported spend?
- How do you define a "conversion" or "sale" in your reporting?
These questions matter because a vendor reporting a 6:1 ROAS on a 30-day attribution window may be claiming credit for sales that closed from organic search, a direct visit, or another vendor's campaign. Without reconciliation, your A/S ratio is built on a flawed denominator.
Pro Tip: Require vendor reporting that matches your dealership's own revenue definition before using any vendor's ROAS figure in an A/S calculation. If a vendor cannot provide spend and attribution details that reconcile to your CRM, that ROAS number should not enter your analysis.
For a practical checklist of signs that vendor reporting may be inflating your apparent efficiency, the dealership marketing waste diagnostic covers the most common patterns. When evaluating which vendors to trust, the dealership marketing agency selection guide outlines the reporting requirements worth demanding upfront. For a deeper look at cost per lead vs. cost per sale distinctions, that resource pairs directly with A/S analysis at the campaign level.
The A/S ratio is a steering metric, not a verdict
The A/S ratio is one of the most useful controls in a marketing budget review, and one of the most misused. Dealers and marketers who treat it as a performance verdict, rather than a directional signal, end up making budget cuts based on a number that does not account for margin, seasonality, or attribution quality.
Vendor-agnostic measurement matters here. When the same vendors who sell you advertising also report the revenue they drove, the A/S ratio they hand you will almost always look favorable. Independent measurement, using CRM-confirmed sales and normalized spend lines, is the only way to know whether your ratio reflects reality.
Pair the A/S ratio with MER for top-line steering and with CPS for campaign-level accountability. No single metric tells the full story, and the dealers who understand that are the ones who stop overpaying for attribution theater.
Autoroiq's independent A/S analysis for dealerships
Dealerships that want a clear, vendor-agnostic read on their advertising-to-sales ratio can work with Autoroiq for independent marketing intelligence. Autoroiq does not sell advertising and has no vendor relationships that create conflicts of interest. The service normalizes spend across all active vendors, reconciles platform-reported revenue against CRM-confirmed sales, and delivers an executive-level analysis of where your budget is working and where it is not.

This is an optional B2B advisory service, not a prerequisite for calculating your own A/S ratio. But if your vendor reports conflict with each other, or if your ratio has been trending in the wrong direction without a clear explanation, an independent review is the fastest way to get a defensible answer.
Request a dealership marketing review to see how Autoroiq's analysis applies to your specific spend mix and revenue profile.
Sources
- Advertising-To-Sales Ratio: Overview, Examples, How to Read It
- Advertising to Sales Ratio - Formula, How To Read It, Examples
- Public Companies' Ad-to-Sales Ratios Increased Last Year