
Demand these three things from every vendor claiming to have mapped your trade area: timestamped isochrone maps generated from a live road network, raw geocoded customer-origin data, and a written methodology statement. If a vendor cannot produce all three, the boundaries they used to report your penetration, cost-per-sale, and attribution are not defensible. The minimum standard for dealership trade area analysis is drive-time isochrone modeling combined with mobility data and customer-origin validation from your CRM or DMS. Anything less corrupts every metric downstream.
- Require timestamped isochrone maps (peak and off-peak runs)
- Request raw origin data, geocoded to at least the block-group level
- Demand a written methodology statement covering traffic source, speed assumptions, and snapshot dates
- If a vendor cannot deliver all three, commission an independent audit before renewing spend
Table of Contents
- What does trade area analysis actually mean for a dealership?
- Why getting your trade area wrong costs you real money
- What data inputs and methods should you require?
- What outputs and KPIs should a quality analysis produce?
- How do you use trade-area outputs to hold vendors accountable?
- Common vendor mistakes and red flags to watch for
- What should you request from vendors? A copyable checklist
- What timeline and cost should you expect?
- What does an independent audit workflow look like in practice?
- Autoroiq delivers independent trade-area audits for dealerships
- Key Takeaways
- The real pattern Autoroiq sees repeatedly
- Useful sources and tools for validating vendor methods
What does trade area analysis actually mean for a dealership?
A trade area is the geographic zone from which a dealership draws the majority of its sales and service customers. Modern trade area analysis is not a circle drawn at a fixed radius. It is an isochrone-based, time-aware, data-layered process that accounts for road networks, traffic patterns, physical barriers, and competitive proximity.
For a dealership, a defensible analysis covers three concentric zones: the primary trade area (typically the source of 50–80% of sales, per industry data), the secondary zone, and a tertiary fringe. Each zone shifts by time of day. A 10-minute drive polygon can shrink by 34% during rush hour compared to off-peak, which means a single static snapshot misrepresents your real catchment for morning, evening, and weekend traffic patterns.
A trade area analysis is only as defensible as its inputs. Maps without timestamps, traffic assumptions, and origin validation are not analysis — they are illustrations.
Mission-critical outputs for dealers include:
- Isochrone maps with timestamps and traffic-condition metadata
- Customer-origin density maps built from CRM or DMS records
- Penetration rates by zone (% of reachable households that purchased)
- Draw curves showing distance decay from the dealership
- Competitive POI overlays showing where rivals compress your catchment
Why getting your trade area wrong costs you real money
Getting the trade area boundary wrong corrupts every downstream metric: demand estimates, competition counts, demographic profiles, and cost-per-sale calculations all flow from the boundary. A boundary that is too wide inflates your addressable market, makes your penetration rate look low, and causes vendors to justify broad targeting spend that reaches households who will never drive to your lot. A boundary that is too tight understates your real reach and leaves revenue on the table.
Stat to know: Primary trade areas typically generate 50–80% of a dealership's sales volume. Misallocating spend outside that zone is not a minor inefficiency — it is a structural budget leak.
Common financial consequences of mis-specified boundaries:
- Overstated cost-per-lead because attributed leads include out-of-area impressions
- Inflated vendor performance scores based on conversions that would have happened organically
- Demand forecasts that overcount reachable households by including unreachable ZIP codes
- Penetration benchmarks that look weak because the denominator is too large
Using ZIP codes or fixed radii as proxies is the most common source of these errors. ZIP boundaries ignore highways, rivers, and commute patterns entirely.
What data inputs and methods should you require?
Drive-time isochrone modeling is the baseline method because it reflects actual road networks and travel friction rather than straight-line distance. Layering in dynamic external data — mobility patterns, traffic density, and competitive proximity improves forecasting accuracy and reduces the risk of misallocating marketing investment.

| Data Input | Typical Source | Role in Validity |
|---|---|---|
| Road network + time-of-day traffic | HERE, TomTom, Google Roads API | Generates accurate isochrone polygons |
| Mobility / foot-traffic data | Placer.ai, SafeGraph, Veraset | Validates actual visit patterns vs. modeled catchment |
| Customer origin addresses | DMS / CRM geocoded records | Ground-truth boundary against real buyers |
| Competitive POI layer | Google Places, Yelp, proprietary | Shows where rivals compress your primary zone |
| Demographics | U.S. Census ACS, Experian | Sizes reachable household count and income profile |
| Event / weather signals | Weather APIs, local event calendars | Explains anomalous traffic spikes in mobility data |
Pro Tip: Ask vendors whether their isochrones are "static" or "traffic-aware." A static isochrone uses average speeds and never changes. A traffic-aware isochrone is re-run against real or historical traffic for a specific day and time window. If the vendor cannot name the traffic data source and the timestamp of the run, the isochrone is static — regardless of what the report claims.
What outputs and KPIs should a quality analysis produce?
Customer-derived trade areas built from POS or CRM origin data routinely reveal boundaries and demographic profiles that differ significantly from theoretical models. That gap is where vendor over-attribution hides.
Core deliverables to require:
- Isochrone maps with timestamp, traffic condition, and generation parameters noted
- Origin-density maps plotting geocoded customer addresses against the modeled zones
- Penetration rate by zone: sold units divided by reachable households in each ring
- Pull-through rate: service and repeat-purchase rate within the primary zone
- Draw curves: a chart showing visit or purchase probability as a function of drive time
- Cannibalization overlays if the group operates multiple rooftops
- Scenario forecasts showing penetration under alternative boundary assumptions
KPIs executives should track:
- Penetration (% of reachable households that purchased in the period)
- Market share within the primary trade area by segment (new, used, service)
- Average drive time for actual customers vs. modeled boundary
- Cost-per-acquisition by geographic zone
- Visit probability at 5, 10, and 15-minute drive bands
How do you use trade-area outputs to hold vendors accountable?
Start with one hypothesis: "The vendor's campaign increased retail purchases from households within our primary trade area." Every reconciliation step tests that claim.
- Request raw origin data. Ask for the geocoded origin file behind every attributed conversion, hashed where privacy rules require. Aggregate ZIP-level counts are not sufficient.
- Pull timestamped delivery logs. Confirm that impressions were served to devices within the modeled primary and secondary zones, not a broad DMA.
- Map attributed conversions against your isochrone. Plot vendor-attributed buyer origins on your trade-area map. What percentage fall inside the primary zone?
- Compute incremental penetration. Compare the vendor's attributed in-zone conversions to your baseline penetration rate from the prior period. If the rate did not move, attribution is suspect.
- Run the reconciliation math. If a vendor reports 200 attributed leads and your CRM shows 40 in-zone sales, the in-zone conversion rate is 20%. Benchmark that against your historical close rate. A large gap signals inflated attribution.
- Check the geo-fence parameters. Confirm the targeting geo-fence matches your trade area, not a broader DMA or metro boundary.
Pro Tip: A practical red-flag threshold: if more than 30–40% of vendor-attributed conversions originate from outside your primary trade area, the campaign's attribution model is likely over-counting. Require the vendor to restate performance using only in-zone origins before approving renewal.
Common vendor mistakes and red flags to watch for
Trade area analysis should be treated as a repeatable science with documented assumptions. Reports that lack documentation are not just incomplete — they are incomparable across periods and vendors, making trend analysis impossible.
Watch for these specific failures:
- Radius-only maps with no road-network modeling
- Non-timestamped isochrones that cannot be reproduced or audited
- ZIP-code proxies used as trade area boundaries
- Missing competitor POIs, which inflate apparent market share
- Aggregated origin counts without geocoding precision metrics
- Single time-of-day snapshot presented as the definitive boundary
A vendor report that shows a clean circular trade area, no competitor locations, and no timestamp is not a trade area analysis. It is a marketing asset dressed as data.
When a vendor uses a DMA as the trade area, every penetration and attribution metric is diluted across a geography that may be three to five times larger than your real catchment. The numbers look modest, the vendor's performance looks necessary, and the budget stays in place.
What should you request from vendors? A copyable checklist
Send this list to any vendor claiming to have performed a trade area assessment:
- Raw geocoded origin file (hashed customer IDs acceptable; ZIP-only is not)
- Isochrone generation parameters: traffic data source, speed assumptions, time-of-day and date of each run
- Competitor POI list used in the analysis, with source and pull date
- Timestamps and snapshot dates for every map and boundary in the report
- Attribution rules: how a conversion is assigned to the campaign vs. organic
- Validation tests: what method was used to confirm boundary accuracy against actual customer origins
- Geocoding precision metric: what percentage of origins were matched to block-group level or better
Many vendors report aggregate counts; requiring a documented geocoding precision metric is the single fastest way to separate vendors doing real work from those producing polished slides.
What timeline and cost should you expect?
| Audit Type | Timeline | Typical Scope |
|---|---|---|
| Quick check | 1–2 weeks | Boundary validation, isochrone spot-check, red-flag review |
| Standard audit | 3–6 weeks | Full input review, origin reconciliation, KPI recomputation |
| Full validation with DMS reconciliation | 6 weeks | POS match, penetration modeling, scenario forecasts, budget reallocation plan |
Cost drivers include mobility and traffic data licensing, geocoding and address cleaning, analyst hours for scenario modeling, and custom forecasting runs. A quick check is appropriate when you suspect a single vendor is over-attributing. Commission a full independent review when you are reallocating a significant portion of your annual marketing budget, adding a rooftop, or when multiple vendors are reporting conflicting results.
Trade area models should be refreshed at least annually, and more frequently when a competitor opens or closes nearby, road infrastructure changes, or your DMS shows a meaningful shift in customer origin patterns.
What does an independent audit workflow look like in practice?
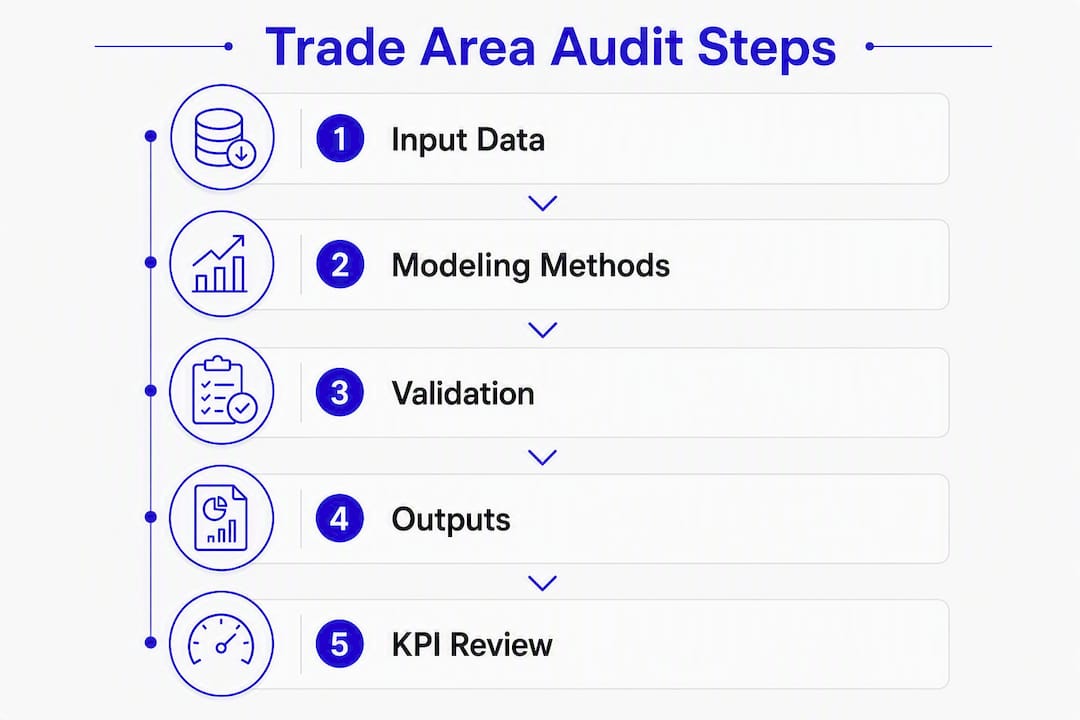
A hypothetical single-rooftop franchise dealership spending $80,000 per month across four vendors would proceed through an audit as follows:
- Intake: collect DMS sales records (24 months), vendor attribution reports, and any existing trade area maps
- Data collection: pull mobility data for the dealership's address, geocode CRM customer origins, compile competitor POI list within a 20-mile radius
- Isochrone modeling: generate peak-hour and off-peak polygons for 5, 10, and 15-minute drive bands
- Origin reconciliation: plot geocoded customer origins against the isochrones; calculate what share of actual buyers fall in each zone
- KPI computation: calculate penetration by zone, average drive time, and cost-per-acquisition by zone using DMS-validated sales
- Recommendations: identify vendors whose attributed conversions skew outside the primary zone and quantify the reallocation opportunity
Sample dashboard elements and what each reveals:
- Penetration curve: shows where the dealership is winning and where it is losing share by drive band
- Origin scatter map: visually confirms or contradicts vendor-claimed targeting geography
- Overlap heatmap: flags cannibalization if a second rooftop is nearby
- Attribution reconciliation table: side-by-side of vendor-reported vs. in-zone validated conversions
A typical output from this process is a concrete budget reallocation: pausing or reducing spend on channels whose attributed buyers are concentrated outside the primary zone, and redirecting that budget toward channels with demonstrated in-zone penetration lift.
Autoroiq delivers independent trade-area audits for dealerships

Autoroiq is the independent alternative to relying on vendor-supplied trade area reports. The firm does not sell advertising and has no financial relationship with any media vendor, which means every finding is based on your data, not on protecting a media relationship. An Autoroiq engagement covers isochrone modeling, customer-origin reconciliation, vendor attribution review, and an executive-level recommendation report with specific budget reallocation guidance.
Dealership executives who have worked through the checklist in this guide and found gaps in vendor documentation are the right candidates for an Autoroiq independent audit. The process is structured, time-bounded, and delivers a defensible scorecard you can take into vendor negotiations or budget planning. Request an independent audit to get a clear picture of where your marketing dollars are actually working.
Key Takeaways
Drive-time isochrones combined with CRM-origin validation and a documented methodology are the minimum defensible standard for any dealership trade area analysis.
| Point | Details |
|---|---|
| Demand isochrones, not radii | Require timestamped, traffic-aware isochrone maps; reject radius-only or ZIP-based boundaries. |
| Primary zone drives 50–80% of sales | Concentrate vendor accountability and spend validation on your primary trade area first. |
| Run origin reconciliation | Map vendor-attributed conversions against your CRM origins to expose over-attribution. |
| Refresh models at least annually | Trade area boundaries shift when competitors open, roads change, or origin patterns move. |
| Autoroiq for independent review | When vendor reports conflict or attribution is unclear, commission an Autoroiq independent audit. |
The real pattern Autoroiq sees repeatedly
The most consistent finding across dealership audits is not that vendors are fabricating data outright. It is that vendors are using trade areas that are far too large, and that choice benefits them more than it benefits the dealership. A DMA-sized trade area makes every impression look targeted and every conversion look attributable. When the boundary is corrected to a defensible isochrone and customer origins are reconciled against it, the in-zone attribution rate often drops substantially, and the case for the vendor's spend level weakens.
The practical correction is straightforward: rebuild the trade area from DMS origins, restate vendor performance using only in-zone conversions, and compare the restated cost-per-sale to your internal benchmark. That single step frequently reveals which channels are genuinely productive and which are running on inflated attribution. Budget reallocation follows directly from the math, not from negotiation.
Useful sources and tools for validating vendor methods
- Trade Area Analysis for Retail Site Selection | Geod: covers isochrone methodology, time-of-day compression, and the consequences of radius-only modeling
- Trade Area Analysis: Methods, Data & Forecasting Impact | Factori: explains how mobility, traffic, and competitive layers improve forecast accuracy
- The Retailer's Guide to Trade Area Analysis | Tango Analytics: emphasizes documented assumptions, repeatable methodology, and update cadence
- Trade area estimation and customer-level approaches | Experts.com: practitioner-level treatment of POS-derived vs. theoretical trade areas and geocoding precision requirements
- GIS isochrone engines to request or validate: Esri Network Analyst, OpenRouteService, Mapbox Isochrone API — ask vendors which engine they used and whether it ingests live or historical traffic
- Mobility data categories: device-derived visit data (aggregated and privacy-compliant) from providers in the location intelligence space; useful for validating modeled catchments against observed visit patterns
- Geocoding vendors: Google Geocoding API, SmartyStreets, Melissa Data — ask for the match-rate report and precision level (rooftop vs. ZIP centroid) on any origin file a vendor supplies