
Freeze your attribution model today, then reconcile it against four numbers vendors rarely put side by side: platform-reported conversions, raw website traffic, call counts, and DMS gross. Pull those figures for the last 30 days before you touch a single budget line. If you can't get raw traffic and call data from a vendor, that gap alone tells you something. An independent review, from AutoROIQ or a comparable third party, can validate the reconciliation before you cut a check or cut a channel.
TL;DR:
- Ensuring data accuracy requires tracking raw website traffic, call volume, and platform conversions simultaneously over the last 30 days.
- Implementing correlation IDs, call tracking, and maintaining UTM hygiene rapidly reduces the gap between vendor claims and actual performance.
- Weekly reconciliation of vendor reports versus an internal ledger prevents overreliance on inflated dashboard metrics and identifies tracking failures.
- Total traffic, phone calls, and deduplication processes are more reliable indicators of marketing value than lead counts alone.
- Ongoing data quality efforts, third-party audits, and vendor-agnostic analysis support better budget decisions and long-term marketing accountability.
Table of Contents
- What Causes Conflicting Marketing Reports Between Vendors?
- Immediate Instrumentation Fixes to Stop the Bleeding This Week
- How Do You Reconcile Vendor Reports on a Weekly Basis?
- Reading Vendor Reports Beyond the Lead Count
- When Should You Pause, Renegotiate, or Increase Vendor Spend?
- Discrepancies That Have Nothing to Do With Platforms or CRMs
- Best Practices for Harmonizing Data Across Marketing Tools
- How Do Privacy Regulations Affect Marketing Data Consistency?
- Visualization Techniques for Comparing Conflicting Vendor Data
- What a Real Reconciliation Looks Like in Practice
- Building Long-Term Data Quality Into Your Marketing Operation
- Why Independent, Vendor-Agnostic Analysis Changes the Conversation
- Get an Independent Reconciliation of Your Vendor Reports
- Sources
What Causes Conflicting Marketing Reports Between Vendors?
Vendor dashboards disagree because they're built to make each vendor look good, not because someone made an error. Last-click attribution hands full credit to whichever channel touched the shopper last, even when four other channels influenced the sale earlier in the funnel. Attribution windows compound the problem: one vendor might count a conversion within 24 hours of a click, another within 30 days, so the same customer shows up as a "win" in two separate reports.
View-through conversions make this worse. A shopper who saw a display ad but never clicked it can still get counted as an ad-driven lead in some platforms, inflating numbers with no real click behavior behind them.
Duplicate leads compound the confusion. A shopper who requests a quote on three different sites in one afternoon generates three "leads" across three vendor reports, but your CRM should only show one real prospect. Add in CRM–DMS disconnection, where marketing systems never talk to the deal desk, and gross profit differences between channels stay invisible. A vendor might also deliver real value through targeting data and audience intelligence that never appears as a named lead at all, creating a known blind spot in how dealers count value from third-party platforms.
Immediate Instrumentation Fixes to Stop the Bleeding This Week
You don't need a six-month systems overhaul to shrink the gap between vendor claims and reality. Four fixes, done in sequence, close most of the divergence within days.
- Stamp a correlation ID at every touchpoint. Assign a unique identifier at the ad click, carry it through the landing page, into the form or call, and log it in the CRM. If your CRM strips URL parameters on submission, that ID dies at the boundary and attribution fidelity collapses right there.
- Deploy call tracking with dynamic number insertion (DNI). Phone calls often carry 40 to 60 percent of dealer pipeline, and if you're not tracking which campaign generated which call, you're flying blind on more than a third of your leads. Configure the CRM to auto-populate campaign and source fields the moment a tracked call lands.
- Fix your UTM hygiene. Landing pages need to preserve campaign parameters through every redirect and form submission. Sloppy UTMs are the single most common reason a platform's click data never survives to appear in the CRM.
- Pilot a DMS to CRM gross sync. Start with front-end gross on a single store or channel. This is what lets you eventually report gross ROAS instead of cost per lead, and it's worth doing even as a limited test.
Pro Tip: Run the correlation ID test manually before you trust it. Click your own ad, fill out the form, and check whether the ID that started at the ad platform is the same one sitting in the CRM record thirty seconds later. If it isn't, you've found your leak.
How Do You Reconcile Vendor Reports on a Weekly Basis?
Reconciliation only works as a discipline, not a one-time audit. The first step is freezing one attribution model at the account or group level and refusing to switch models mid-quarter chasing better-looking numbers. Every platform's own attribution model is that platform's opinion of what happened, not a neutral record of fact.
From there, run a weekly rebase job on a trailing 7-day window, timed for Sunday midnight, and publish the result to an internal ledger that nobody edits after the fact. That immutable record becomes your source of truth, independent of whatever any single vendor claims that week.
- Produce a two-number delta report every week: platform-reported figure versus internal-ledger figure, broken out by channel.
- Flag any channel where the delta exceeds plus or minus 25 percent for investigation, not immediate action.
- Enforce a 24-hour cooldown after any flagged delta. No budget changes get approved same-day.
- Execute approved changes on Tuesday, after the cooldown has passed and the numbers have been checked twice.
A ±10 percent swing week to week is normal noise. A swing in the ±25 percent range is diagnostic and worth digging into, and anything near ±40 percent usually means an instrumentation failure, not a real shift in channel performance. Cap your attribution window at 30 days and footnote anything that attributes later than that.
Reading Vendor Reports Beyond the Lead Count
A lead count is the least useful number on most vendor dashboards, because it's the easiest number to manipulate through duplicate submissions and loose form logic. Ask every vendor for the same underlying data set, not just the summary they choose to send.
- Request total traffic, VDP views, and phone-call volume alongside lead counts, not as an afterthought.
- Ask for the vendor's deduplication logic in writing. If they can't explain how they filter duplicates, assume they don't.
- Get vendors to describe, specifically, how their targeting and audience data create value beyond direct leads. Insiders in this space have told industry writers that leads represent roughly half of what dealers pay for, with the rest sitting in traffic and market intelligence.
- Negotiate contract terms around minimum lead completeness, a maximum acceptable duplicate rate, defined cancellation windows, and pilot terms you can exit cleanly if the numbers don't hold up.
When Should You Pause, Renegotiate, or Increase Vendor Spend?
Budget decisions built on cost per lead routinely reward the wrong channel, because cost per lead says nothing about what happens after the lead lands. Gross return on ad spend, tracked against your DMS, is the number that should drive the call, since it ties spend directly to the deals it produced.
- If the platform-versus-internal-ledger delta stays above threshold for two consecutive weeks, diagnose your tracking setup before you touch the budget. A tracking problem dressed up as a performance problem is the costliest mistake on this list.
- If a vendor's cost per sale runs well above what your owned channels deliver for a comparable unit, that's your cue to renegotiate terms or shrink your dependency on that source. Some analyses put duplicate lead rates from third-party providers as high as 30 to 40 percent, which alone can explain a bloated cost per sale.
- When you're not sure yet, don't guess. Freeze the model, fix the tracking gaps, and run a 30 to 60 day pilot with fixed KPIs before making a permanent call.
| Signal | Recommended action |
|---|---|
| Delta under ±10% | Normal variance, no action needed |
| Delta ±10% to ±25% | Monitor, note in weekly ledger |
| Delta over ±25% for 2+ weeks | Diagnose instrumentation before touching budget |
| Cost per sale far above owned-channel benchmark | Renegotiate terms or reduce dependency |
| Genuine uncertainty | Freeze model, fix tracking, pilot 30 to 60 days |
Discrepancies That Have Nothing to Do With Platforms or CRMs
Not every mismatch traces back to attribution windows or lead duplication. Data latency causes real trouble on its own: one vendor's dashboard updates in near real time, another batches overnight, and a third refreshes weekly. Pull two reports on a Wednesday morning and you're comparing a live feed against a stale one, even though both vendors are technically "correct" for their own refresh cycle.
Sample size differences distort smaller stores and single-rooftop groups especially hard. A platform reporting a conversion rate off 40 clicks behaves very differently than one reporting off 4,000, and a single anomalous week can swing the smaller sample's percentage wildly without reflecting any real change in performance.
Tracking pixel failures are quieter but just as damaging. A pixel that fails to fire because of a slow-loading page, an ad blocker, or a botched site redesign will simply undercount conversions with no error message telling anyone it happened. Browser privacy settings and cookie restrictions add another layer, silently dropping tracked sessions that a vendor's report never flags as missing.
Even something as mundane as time zone handling causes disagreements: a vendor logging conversions in Pacific time and a CRM logging them in Eastern time will occasionally split a single day's activity across two different reporting periods. None of these causes involve bad faith on anyone's part. They're the ordinary friction of stitching together systems that were never built to talk to each other, and they're exactly why a weekly reconciliation habit matters more than chasing down every individual glitch.
Best Practices for Harmonizing Data Across Marketing Tools
Harmonization starts with picking one system of record and refusing to let every tool argue for its own version of the truth. That system should usually be the CRM, since it's the closest thing you have to a ledger of what actually happened with each lead.
Standardize field names and formats before you standardize anything else. If one platform logs "Source" as a free-text field and another uses a fixed dropdown, no amount of downstream analysis will reconcile them cleanly. Build a single mapping document that translates every vendor's terminology into your internal taxonomy, and require any new tool to conform to it before it goes live.
A shared reporting layer, built in a business intelligence tool that pulls from the CRM, DMS, and ad platforms directly rather than relying on manual exports, cuts down on the version-control chaos of five people working from five spreadsheets. Tools like Power BI or Tableau can serve this role for a dealership group that's ready to centralize reporting instead of stitching together CSVs every Monday.
Assign one owner for data governance, even if it's a part-time responsibility layered onto an existing role. Without a named owner, harmonization efforts quietly decay every time a vendor changes their export format or a new tool gets bolted onto the stack.
How Do Privacy Regulations Affect Marketing Data Consistency?
Privacy rules are quietly rewriting how consistent marketing data can even be. Browser-level restrictions on third-party cookies, combined with state-level privacy laws, have made cross-platform tracking less reliable than it was even a few years ago, and that decline hits every vendor differently depending on how they source their data.
Platforms that rely heavily on third-party cookie tracking see steeper drops in match rates than those built around first-party data captured directly through owned forms and call tracking. That's part of why two vendors reporting on the same campaign can show meaningfully different conversion numbers: one might be working from a shrinking pool of trackable sessions while the other captures data directly at the point of contact.
Consent requirements add friction that varies by state and by how aggressively a given platform pursues opt-in tracking. A shopper who declines tracking on one site but not another creates an intentional data gap that no reconciliation process can fully close, because the information genuinely isn't there.
The practical response isn't panic, it's a shift in emphasis. First-party data captured through your own website forms, call tracking, and CRM becomes more valuable relative to third-party platform data every year privacy rules tighten further. Building your reconciliation ledger around data you control directly, rather than data a vendor collected through methods increasingly restricted by browsers and regulators, is the more durable long-term position.
Visualization Techniques for Comparing Conflicting Vendor Data
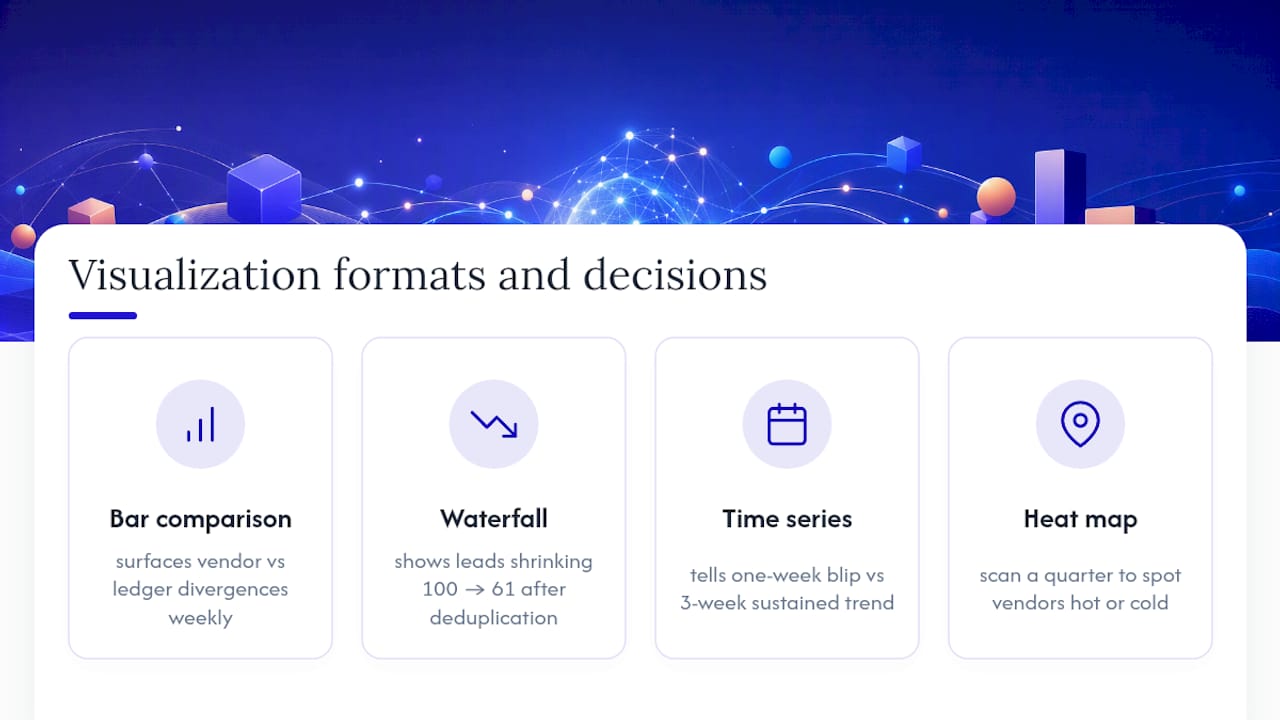
A side-by-side bar chart comparing platform-reported figures against your internal ledger, refreshed weekly, does more to surface a problem than any spreadsheet buried in tabs. The moment two bars diverge by more than your threshold, the chart does the flagging work for you.
Waterfall charts work well for showing where a lead count shrinks as it moves from raw platform claim down to verified CRM record, making duplicate removal and disqualification visible instead of hidden in a single final number. A funnel that starts at 100 leads and ends at 61 after deduplication tells a much clearer story than the raw 100 ever could.
Time-series line charts, plotted against your weekly rebase dates, reveal whether a delta is a one-week blip or a sustained trend worth acting on. A single spike rarely justifies a budget change; three consecutive weeks trending the same direction usually does.
Heat maps applied across channels and weeks let an executive scan a full quarter in one glance and spot which vendor consistently runs hot or cold relative to the internal ledger, without reading a single row of raw numbers. None of these require exotic software. A well-structured spreadsheet with conditional formatting can produce most of them; a dedicated BI tool just makes the weekly refresh less manual.
What a Real Reconciliation Looks Like in Practice
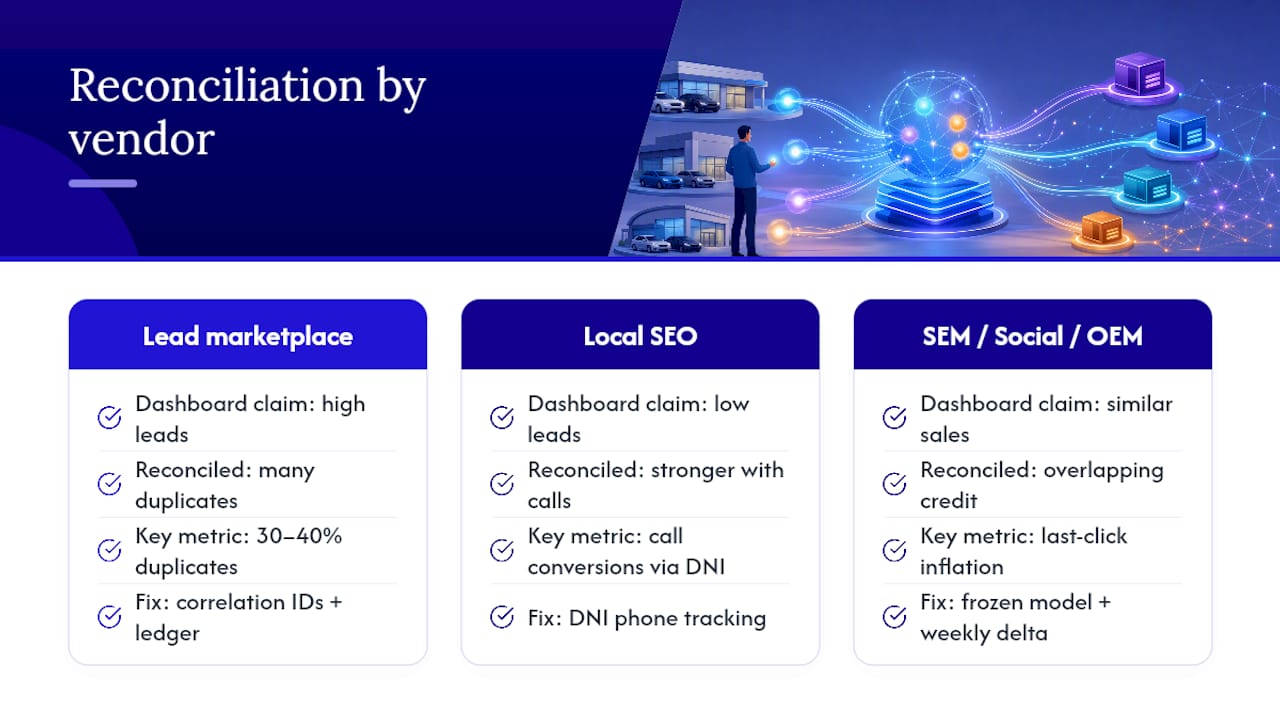
Consider a dealership group running five vendors across SEM, a third-party lead marketplace, social ads, an OEM co-op program, and a local SEO partner. Each vendor's dashboard claimed credit for roughly the same block of sales, and the sum of all five vendor-reported conversions exceeded total units sold that month by a wide margin. That's the classic symptom of overlapping last-click credit with no reconciliation layer sitting on top of it.
The fix wasn't dropping a vendor. It was building the internal ledger described earlier: correlation IDs tied to CRM records, a frozen attribution model, and a weekly delta report comparing each vendor's claim against verified CRM outcomes. Within a few weekly cycles, the group could see that the lead marketplace's duplicate rate was inflating its reported lead count well beyond what the CRM confirmed as unique prospects, a pattern consistent with the 30 to 40 percent duplicate rates documented across third-party providers generally.
The local SEO partner, by contrast, showed a small reported lead count but a disproportionately strong showing in the internal ledger once phone calls were properly tracked with DNI. Its dashboard had simply never been credited for the calls it was actually driving. Granular click-level analysis, the kind offered by country-level click analytics platforms, can help isolate exactly which traffic segments are converting once you have that level of tracking in place.
The lesson holds beyond this one example: the vendor with the biggest dashboard numbers isn't always the one creating the most value, and you won't know which is which until the reconciliation ledger tells you.
Building Long-Term Data Quality Into Your Marketing Operation
A single reconciliation cycle fixes a single month's confusion. Lasting data quality comes from treating reconciliation as a permanent operating rhythm rather than a project with an end date. That means keeping the weekly cadence running indefinitely, not just during a crisis month when the numbers looked obviously wrong.
Vendor contracts should build in ongoing data quality commitments, not just initial pilot terms. Renewal conversations are the right moment to demand improved deduplication logic, faster data refresh cycles, or better call attribution as a condition of continued spend, not a one-time ask you make and then forget.
Training matters more than most dealership groups budget for it. The person pulling weekly numbers needs to understand what a correlation ID failure looks like in raw data, not just how to copy numbers into a spreadsheet. A team that can spot a broken tracking pixel from a sudden unexplained conversion drop catches problems weeks before a full monthly report would surface them.
Periodic third-party review adds a check that internal teams, however diligent, tend to miss simply because they're close to the data every day. An outside audit of vendor performance at even a quarterly cadence catches drift that accumulates slowly enough to go unnoticed internally. Combined with a closed-loop attribution approach that ties every marketing dollar back to a DMS-verified outcome, this is what separates a dealership that reacts to vendor claims from one that verifies them.
Why Independent, Vendor-Agnostic Analysis Changes the Conversation
Every vendor has a reason to present their own numbers in the best light. That's not a criticism, it's simply how a sales relationship works, which is exactly why the reconciliation layer needs to sit outside any single vendor's dashboard.
The methodology is built around that gap, evaluating vendor performance and channel data without selling advertising or defending any platform's numbers. The outcome dealers report most consistently is faster, more defensible budget decisions and less time spent litigating whose dashboard is right.
— AutoROIQ
Get an Independent Reconciliation of Your Vendor Reports
Running the frozen-model and delta-report discipline described above takes real staff time, and most dealership marketing teams are already stretched across a dozen vendor relationships. The practice is designed to take that reconciliation off your plate: independent vendor scorecards, a channel-by-channel gross ROAS breakdown, and executive-level recommendations you can act on without wondering whose numbers to trust.

Engagements come in two shapes. A one-time independent marketing performance review gives you a clean, executive-ready reconciliation ledger and a scored breakdown of every vendor's real contribution, useful if you just need clarity before a renewal decision. An ongoing advisory relationship keeps that ledger current every week, with vendor accountability built into the cadence rather than reconstructed once a year under deadline pressure. Because it doesn't sell media or take vendor commissions, the recommendations you get are built solely around what moves your gross ROAS, not around defending anyone's ad budget. If your vendor reports have stopped agreeing with each other, or with your DMS, schedule a review with AutoROIQ and get a reconciliation built on your own numbers instead of five competing dashboards.
Sources
- Third-party platforms: you are only counting half of what you’re paying for — DealerIntel
- How to run a weekly multi-channel attribution cadence — AUTONOMi blog
- How to measure marketing ROI in automotive retail — Keyloop