
An executive marketing dashboard is a single decision-ready view that ties marketing spend directly to pipeline and revenue, built around a handful of board-grade KPIs rather than dozens of channel metrics. The best ones prioritize unit-economics numbers like CAC payback and LTV/CAC, marketing-sourced pipeline, and blended ROI. Done right, it cuts prep time before leadership meetings and points to the next decision, not just the last quarter's activity.
TL;DR:
- A decision-ready marketing dashboard should focus on metrics like pipeline contribution, CAC payback, and LTV/CAC rather than channel activity metrics.
- Dashboards must present a stable layout, reconcile data sources accurately, and include deltas with contextual notes to support quick decision-making.
- Leading indicators such as pipeline percentage and speed of conversion should be shown alongside lagging metrics like ROI and gross margin.
- Regularly verify data connections, define source authority, and document formulas to prevent prolonged decay in accuracy and trust.
- Monthly or weekly reviews should incorporate a narrative of what changed and why, with dashboards designed for export into board presentations for efficiency.
Table of Contents
- What Are the Core KPIs for Marketing Executives?
- What Layouts Do Executives Actually Use?
- How Should You Design a Dashboard Executives Trust?
- How Do You Build and Govern the Data Behind It?
- How Does This Apply to Dealership Marketing?
- How Often Should Leadership Review the Dashboard?
- What Tools Do Executives Commonly Use?
- How Do You Keep the Data Accurate Over Time?
- What Happens When Executives Trust the Dashboard?
- What Changes When the Dashboard Actually Works
- How AutoROIQ Builds Executive-Ready Marketing Dashboards for Dealerships
- Where to Find Dashboard Templates and Governance Guides
- Sources
What Are the Core KPIs for Marketing Executives?
Most marketing reporting fails executives for one reason: it reports activity instead of consequence. A dashboard listing impressions, click-through rates, and email opens tells a CMO what the team did. It does not tell a CEO whether the business is getting a return on its marketing investment. That distinction shapes every KPI choice below.
CMO-level dashboards should center on pipeline contribution, blended customer acquisition cost, CAC payback, LTV/CAC, and one leading brand indicator, rather than channel-by-channel tactical metrics, according to guidance from Bricks. Each of these maps to a real decision, not a vanity metric.
| KPI | Formula (basic) | Decision it supports |
|---|---|---|
| Marketing-sourced pipeline % | Marketing-sourced pipeline ÷ total pipeline | Whether to shift budget toward or away from marketing-generated demand |
| Blended CAC | Total sales + marketing spend ÷ new customers acquired | Whether acquisition cost is trending sustainable or not |
| CAC payback period | CAC ÷ (monthly revenue per customer × gross margin %) | How long cash is tied up before a customer turns profitable |
| LTV/CAC ratio | Customer lifetime value ÷ CAC | Whether spend levels are proportionate to long-term value |
| Marketing ROI | (Revenue attributable to marketing − spend) ÷ spend | Whether a channel or campaign category deserves more budget |
| Gross margin | (Revenue − cost of goods sold) ÷ revenue | Whether revenue growth is actually improving profitability |
Some of these are leading indicators (pipeline percentage, conversion velocity) and some are lagging (ROI, gross margin). Keep both on the same page. A leading indicator tells you where things are headed before the lagging numbers confirm it, and a dashboard that only shows lagging metrics leaves executives reacting to problems a full quarter late.
What Layouts Do Executives Actually Use?
Executive dashboards succeed or fail on layout discipline. A page crowded with 20 tiles gets skimmed once and ignored afterward. The templates that stick share a few structural habits.
- A top-row scorecard with four to six headline tiles, each showing the current value and the delta versus last period, not just a static number.
- Driver panels underneath, breaking down pipeline by source, funnel health by stage, and channel-level impact for anyone who wants to dig deeper.
- A brand or awareness indicator sitting near the financial tiles, since paid-and-organic reach still matters even though it does not close deals directly.
- Templates commonly pair a top-line scorecard covering spend, pipeline, bookings, and ROI with a direct line connecting spend to pipeline and revenue, cutting the analysis time a leadership team needs to reach a decision, per RevSure.
The layout should also flex by audience. A CEO-facing version leans harder on revenue and payback; a CMO-facing version keeps more channel and funnel detail visible; a revenue-review deck for the full leadership team usually blends both and exports cleanly to slides for board use.
How Should You Design a Dashboard Executives Trust?
Design discipline is what separates a dashboard leadership actually uses from one that gets built once and ignored by the third meeting. An executive dashboard should function as a single, decision-ready view that highlights what changed and connects each change to a driver and a next action, rather than a raw data dump, according to Fusedash.
Four rules keep that promise:
- Keep the layout stable meeting over meeting. Executives build pattern recognition over time, and a dashboard that moves tiles around every quarter resets that recognition to zero.
- Govern every metric definition centrally, so "pipeline" or "revenue" means the same thing in every leadership deck across every department.
- Show period-over-period deltas alongside a short written note on what changed and why, not just a raw number sitting in isolation.
- Reconcile every metric to one authoritative source system, and document the formula so a skeptical CFO can trace it back.
Pro Tip: Push tactical, campaign-level detail into a drill-down layer instead of deleting it. Executives rarely need it on the main page, but someone in the room will ask a follow-up question, and having the answer one click away beats promising to "get back to you."
How Do You Build and Govern the Data Behind It?
The dashboard layer is the easy part. The harder work happens underneath, in the data connections and the rules governing what counts as truth.
Three systems form the baseline: your CRM for pipeline and closed revenue, your billing or accounting system for actual revenue and margin, and your ad platforms or spend trackers for cost. Skip any one of these and the dashboard will show numbers that look clean but do not reconcile with what finance reports separately, which is exactly the gap that erodes executive trust.
- Be explicit about attribution method. When multi-touch attribution is not available, credible reporting can still work by showing "sourced" pipeline and stating the attribution assumption plainly, rather than presenting a number as more precise than it is, per Bricks.
- Document formulas once, in one place, and link back to them from the dashboard itself.
- Set a refresh cadence that matches your leadership review rhythm, whether that is weekly or monthly.
- Define access rules so the same numbers a marketing director sees are the ones a CFO sees, with no separate "internal" version floating around.
- Build an export path so the dashboard becomes the board deck, instead of someone rebuilding the numbers manually in slides the night before.
A dealership CRM built around clean reporting habits makes this reconciliation step considerably less painful than retrofitting governance onto a system that was never designed for it.
How Does This Apply to Dealership Marketing?
Franchise dealership leadership cares less about impressions and more about CAC payback period, LTV/CAC ratio, and marketing-sourced or influenced pipeline percentage, alongside a leading brand indicator, ahead of tactical channel metrics. A vendor-agnostic scorecard matters here specifically because dealerships routinely receive conflicting performance claims from multiple ad vendors, each reporting numbers that flatter its own channel.
When every vendor grades its own homework, the general manager ends up with five different "winning" channels and no way to tell which one actually moved revenue. A dashboard reconciled against CRM and billing data, not vendor self-reporting, is the only version a GM can defend to ownership.
Autoroiq's approach to reconciling vendor performance claims exists precisely to close that gap between what a vendor reports and what the dealership's own numbers show.
How Often Should Leadership Review the Dashboard?
Cadence determines whether a dashboard becomes a living tool or a slide nobody opens between quarterly meetings. Weekly reviews suit fast-moving performance marketing programs, where spend shifts and lead flow change quickly enough to justify frequent check-ins. Monthly cadence fits most dealership and mid-market marketing programs, where campaign cycles and inventory turns move on a slower clock.
The dashboard's job in a leadership review is not to present raw numbers cold. A short narrative layer, sometimes called "what changed," should sit alongside the visual KPIs so leaders see direction and a suggested action without digging through raw reports themselves, a pattern Asana recommends for exactly this reason. That narrative layer is what turns a fifteen-minute dashboard review into a decision, instead of a fifteen-minute re-explanation of numbers everyone already saw in an email.
For board decks specifically, the dashboard should export cleanly without a rebuild. If someone has to manually recreate the marketing slide in PowerPoint every month, the dashboard has failed its core job. The export itself, not a separate summary document, should become the board artifact. That also forces discipline on the design side: a dashboard nobody can export cleanly usually has too many tiles or too much unresolved noise to belong in a board deck in the first place.
What Tools Do Executives Commonly Use?
Executive dashboard tools generally fall into three categories, and the right one depends less on company size than on where your source data already lives.
General-purpose BI platforms, like the kind compared in Autoroiq's Power BI versus Tableau breakdown, offer the deepest customization and the steepest setup curve. They suit organizations with a dedicated analyst who can build and maintain the connections. Purpose-built marketing dashboard products trade some customization for faster setup, arriving with prebuilt connectors to common CRM and ad platforms. Spreadsheet-based dashboards remain common at smaller dealerships and mid-market companies, and they work fine as a starting point, provided someone owns the manual reconciliation work that automated tools would otherwise handle.
User demand consistently points toward template libraries and easy connectors to CRM, billing, and ad platform data, based on G2 reviews of dashboard tools, which suggests most organizations would rather start from a proven layout than design one from scratch. That preference makes sense. Getting the underlying connectors and definitions right is the harder 80%, and a template at least standardizes the easy part so attention goes where it belongs.
Whichever category you choose, the tool matters less than whether it can pull from your actual source systems without a manual export step in between. A dashboard with a beautiful interface that still requires someone to copy numbers from a spreadsheet each week is not a real dashboard. It is a slide with extra steps.
How Do You Keep the Data Accurate Over Time?
A dashboard built well on day one degrades quietly if nobody maintains it. Source systems change field names, sales teams redefine what counts as a qualified lead, and a connector that worked fine six months ago silently breaks when a vendor updates its API.
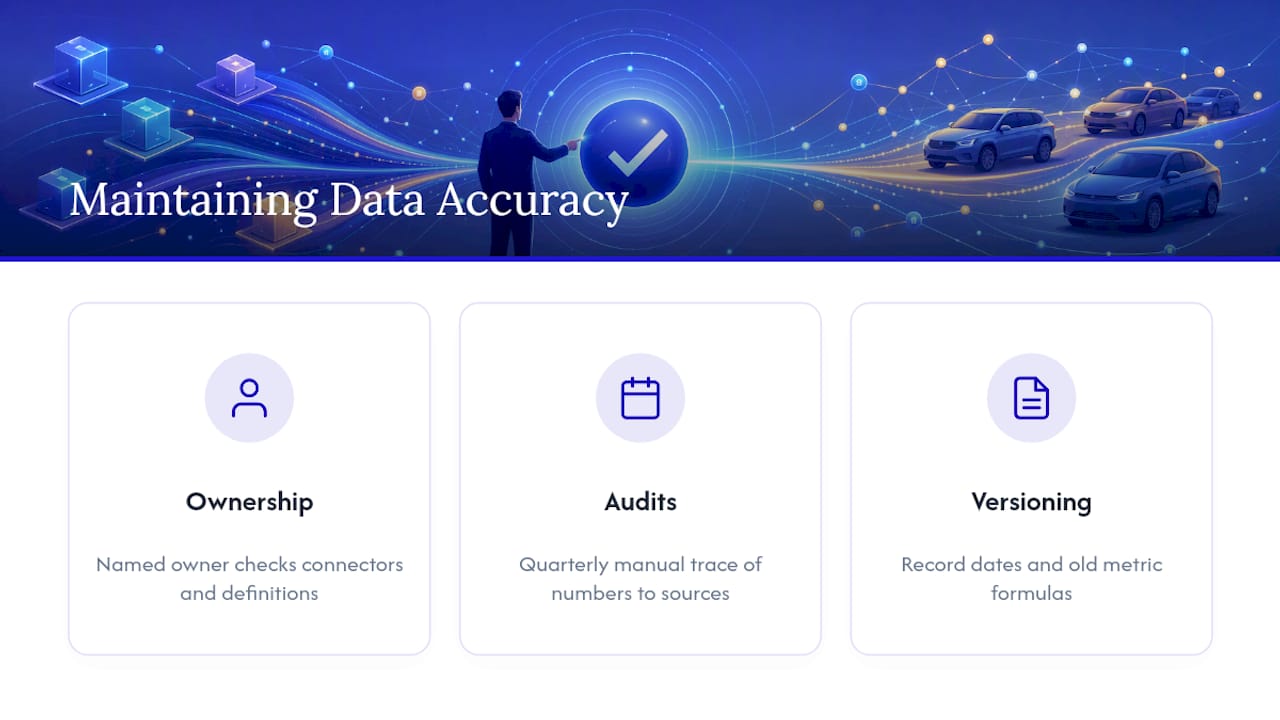
Three habits prevent that slow decay. First, assign clear ownership. Someone specific, not "the marketing team" generally, should be responsible for checking connector health and flagging definitional changes before they corrupt a quarter's worth of reporting. Second, schedule a periodic audit, quarterly at minimum, where someone manually traces a sample of dashboard numbers back to their source systems and confirms they still reconcile. Third, version your metric definitions the way you would version software. If "marketing-sourced pipeline" changes definition, note the date and the old formula, so a year-over-year comparison does not silently compare two different things without anyone noticing.
Reconciliation across billing, CRM, and accounting data is what actually makes a dashboard board-grade rather than merely informative, a distinction worth taking seriously given how much leadership trust rides on it, according to Definite. That trust erodes fast and rebuilds slowly. One leadership meeting where the numbers do not hold up under a pointed question can undo months of dashboard credibility.
What Happens When Executives Trust the Dashboard?

The clearest evidence for a well-built executive dashboard is not a feature list. It is what happens in the room during a leadership review once the dashboard is doing its job.
Before reconciled reporting, a typical quarterly marketing review might open with fifteen minutes of arguing about whose numbers are right, marketing's channel report against finance's revenue figures against the CRM's pipeline count. That time comes entirely out of the decision-making budget for the meeting. Once a dashboard reconciles those sources into one governed view, that argument disappears, and the conversation shifts to what the numbers imply and what to do next.
The second shift is subtler but matters more. Without a shared dashboard, each department head tends to defend their own channel's performance using whatever metric flatters it most. With a shared, governed view, the conversation moves from defending individual channels to discussing the business's actual unit economics, which is a fundamentally different and more useful conversation for a leadership team to have. A dealership general manager working from a reconciled scorecard can walk into an ownership meeting and defend a budget decision with numbers that trace cleanly back to CRM and billing data, rather than a vendor's self-reported campaign summary.
What Changes When the Dashboard Actually Works
Leadership reviews get shorter once a dashboard is doing its job right. Less time gets spent reconciling conflicting reports, and more time goes to deciding what to do about a single number everyone already trusts. That shift, from arguing over which report is correct to arguing about strategy, is the real measure of whether a dashboard earned its place in the room.
— AutoROIQ
How AutoROIQ Builds Executive-Ready Marketing Dashboards for Dealerships
Dealership leadership teams rarely lack data. They lack a version of it everyone in the room agrees to trust. Autoroiq builds that version by staying vendor-agnostic: no advertising sold, no channel to protect, just an independent reconciliation of what every vendor reports against what the dealership's own CRM and billing systems actually show.

That independence changes what a leadership review looks like. Instead of five vendor scorecards claiming five different channels drove results, dealership leaders get one governed view of blended CAC, CAC payback, LTV/CAC, and marketing-sourced pipeline, built to hold up under a direct question from ownership or a lender. Engagements typically shorten review cycles and give general managers a defensible basis for reallocating budget, rather than a vendor's self-graded report card. If your leadership team is tired of reconciling conflicting numbers before every meeting, start a marketing intelligence review with AutoROIQ and get one number everyone in the room can trust.
Where to Find Dashboard Templates and Governance Guides
For a starting layout, RevSure's executive marketing dashboard template shows the scorecard structure discussed above. Porter Metrics' template library covers connector setup for common CRM and ad platforms, and Autoroiq's closed-loop attribution guide addresses the attribution assumptions every governance checklist needs to document.
Sources
Every executive dashboard project hits the same wall eventually: your CRM says one number, your billing system says another, and your ad platforms report a third that does not match either. This is not a tooling failure. It is a structural reality of combining systems that were never designed to talk to each other.
Timing mismatches cause a large share of these fights. A CRM might mark a deal "closed won" the day a sales rep updates the record, while the accounting system does not recognize revenue until an invoice is paid, sometimes weeks later. If your dashboard pulls closed-revenue figures from both systems without reconciling the timing gap, you get two different revenue numbers on the same page, and the first question in any leadership review becomes "why don't these match" instead of a real strategic discussion.
Definitional drift is the second common fight. Marketing might define a "lead" as any form fill, while sales defines it as a qualified opportunity worth pursuing. Neither definition is wrong, but a dashboard that blends both without labeling which is which produces numbers that look precise and mean nothing consistent.
The fix in both cases is the same: pick one authoritative source per metric category, document the definition, and route every other system's version through that one point of truth. Billing and accounting should own revenue and margin. CRM should own pipeline and deal stage. Ad platforms should own cost and reach. When a discrepancy shows up, the governance document tells you which number wins, instead of forcing a debate every time the numbers disagree.
- Executive Dashboard for Leadership Decisions | Fusedash
- CMO dashboard: Marketing dashboard for the board | Bricks
- Your Executive Dashboard, the whole business on one screen | Definite
- Executive Marketing Dashboard | RevSure