
The right ad budget allocation is not a fixed percentage split you set once a year. It is a repeatable process that pushes dollars toward the channels producing the best marginal return right now, while protecting a minimum floor for brand-building and test-and-learn work. Get the process right, and the specific numbers take care of themselves.
Here's what to do this week if your current allocation feels stale or defensive:
- Reweight, don't rebuild. Pull your last 90 days of channel-level cost and conversion data, calculate marginal return at the margin (not average ROAS), and shift 10 to 15 percent of budget from your weakest-performing channel to your strongest.
- Set guardrails before you move money. Define a minimum viable spend for every channel you keep, especially brand and awareness, so short-term optimization doesn't quietly starve long-term demand.
- Put reallocation on a calendar. Weekly for tactical shifts, monthly for budget category reviews, quarterly for strategic resets. Ad hoc reallocation is how budgets drift into chaos.
Marginal-ROAS thinking, not fixed splits, is the core discipline behind effective budget allocation across paid channels, since every channel eventually hits diminishing returns and the winners shift week to week. Marketing budgets as a share of revenue have also moved in recent years, and Statista's global tracking gives you a useful anchor point before you dig into the channel-level detail later in this piece.
Key Takeaways
Effective ad budget allocation requires equalizing marginal returns across channels, protecting minimum spend for testing and brand, and reallocating on a set cadence rather than a fixed annual split.
| Point | Details |
|---|---|
| Reweight based on marginal ROAS | Shift budget from the weakest marginal performer toward the strongest one this week, not next quarter. |
| Protect channel minimums | Keep a learning floor on every retained channel so you're not starting from zero if you need it later. |
| Reallocate on a fixed cadence | Review tactically every week, reset the channel mix monthly, and revisit strategy quarterly. |
| Audit hidden costs first | Reconcile invoiced spend, check audience overlap, and separate agency fees from true media cost before cutting a channel. |
| Bring in independent review when complexity grows | Autoroiq's vendor-agnostic performance reviews help dealerships validate PVR and attribution decisions without vendor bias. |
Table of Contents
- Why Ad Spend Distribution Discipline Actually Affects Profit
- Which Budgeting Model Fits Your Business Right Now?
- How Do You Build an Ad Budget Step by Step?
- What Are Typical Channel Allocation Benchmarks?
- Which Metrics Should Drive Reallocation Decisions?
- How Do You Find Hidden Budget Drains?
- When Should You Reallocate Mid-Cycle?
- What Do Sample Ad Budget Allocations Look Like?
- How Should Dealerships Adapt This Framework?
- Frequently Asked Questions
- Sources
Why Ad Spend Distribution Discipline Actually Affects Profit
A sloppy ad spend distribution doesn't just underperform. It actively erodes margin, and most leadership teams don't see it happening until the quarterly numbers come in soft.
Here's the mechanism: when you keep funding a channel because "that's what we budgeted," rather than because it's still producing efficient customer acquisition cost relative to lifetime value, you're paying full price for diminishing returns. Every dollar spent past a channel's efficient point drags down your blended CAC:LTV ratio. Meanwhile, a higher-performing channel sits underfunded because nobody revisited the split since the annual planning meeting.
HBS guidance on digital marketing budgets makes the point directly: goals, past performance, channel characteristics, and available resources should drive the split, not a default percentage carried over from last year. Yet most organizations still run static, slide-deck allocations that get locked in during annual planning and rarely revisited until the next cycle.
Five failure patterns show up again and again in budget reviews:
- Static annual splits. The allocation gets set once, presented in a slide deck, and treated as fixed for 12 months regardless of what performance data says mid-year.
- Average ROAS worship. Leaders look at blended return on ad spend and miss that the last dollar in a channel might be performing far worse than the first dollar.
- No marginal-return thinking. Budgets get allocated based on total volume a channel can deliver, not the efficiency of the next incremental dollar.
- Broken or partial attribution. Multi-touch journeys get credited to last-click, which systematically overfunds bottom-funnel channels and starves upper-funnel ones.
- Hidden non-media costs. Agency fees, creative production, martech licensing, and platform management fees quietly eat 15 to 25 percent of "media budget" without ever appearing in the channel-performance conversation.
Pro Tip: Run a quick audit: pull your last quarter's channel-level spend and compare the marginal ROAS of your top and bottom 20 percent of budget dollars in each channel. If the gap is wide, you have room to reallocate without spending a single new dollar.
Which Budgeting Model Fits Your Business Right Now?
No single model works for every stage of growth or every organizational structure. The right approach usually blends two or three of the five common frameworks below, and the mix should change as your business matures.
Percentage-of-revenue ties ad spend to a fixed share of top-line revenue, recalculated each planning cycle. It's simple to explain to a CFO and scales naturally with the business, but it ignores marginal returns entirely and can overfund a channel during a slow revenue quarter when spend should actually increase to compensate.
Objective-based budgeting starts from a specific goal (a lead volume target, a sales number, a market-share objective) and works backward to the dollars required to hit it. This model forces discipline around what you're actually trying to achieve, though it demands accurate cost-per-outcome data to avoid wildly optimistic assumptions.
Historical-with-adjustments takes last year's actual spend and modifies it based on known changes (new competitor entry, a product launch, a market expansion). It's fast and grounded in real data, but it can perpetuate old mistakes if the historical baseline was never audited for waste.
Zero-based budgeting rebuilds the entire allocation from scratch each cycle, justifying every dollar against current goals rather than prior spend. It surfaces waste that historical models hide, but it's resource-intensive and can create planning fatigue if applied every single quarter.
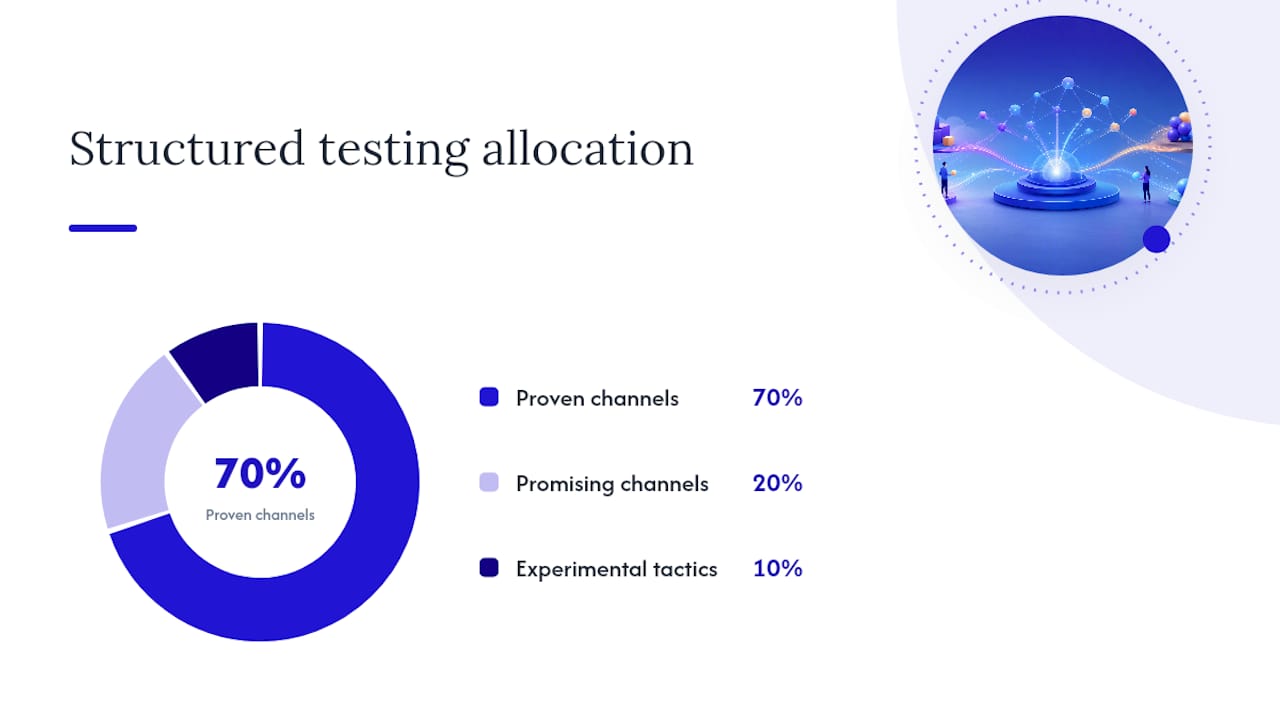
The 70:20:10 model allocates 70 percent to proven, reliable channels, 20 percent to channels showing promise but needing more data, and 10 percent to experimental or emerging tactics. It builds testing into the structure itself rather than treating experimentation as an afterthought.
| Model | Best fit | Main tradeoff |
|---|---|---|
| Percentage-of-revenue | Established businesses with stable margins | Ignores marginal returns and channel-level performance |
| Objective-based | Teams with a specific, measurable target | Requires accurate cost-per-outcome data upfront |
| Historical-with-adjustments | Mature programs with clean prior-year data | Can carry forward undetected waste |
| Zero-based | Organizations suspecting significant budget leakage | Time-intensive; hard to sustain every cycle |
| 70:20:10 | Teams wanting structured experimentation | Requires discipline to protect the 10% test bucket |
Most experienced marketing leaders blend historical-with-adjustments for the core budget with a 70:20:10 overlay for testing. That combination gives you a defensible baseline plus a built-in mechanism for finding tomorrow's efficient channel before your competitors do.
How Do You Build an Ad Budget Step by Step?
A defensible ad budget follows a sequence. Skip a step, and the plan you bring to leadership will have a hole someone in the room finds within the first five minutes.
- Map business goals to channel-level KPIs. A revenue goal translates differently than a lead-volume goal or an awareness goal. Decide upfront whether you're optimizing for sales, cost per lead, or reach, because that choice determines which channels deserve priority funding.
- Audit past performance and hidden costs. Pull 12 months of actual spend by channel, then separate true media cost from agency fees, creative production, and platform or martech licensing. Most teams underestimate non-media costs by a wide margin until they actually itemize them.
- Estimate marginal returns and set minimum viable spend. For every channel, identify the point where an additional dollar stops producing efficient results. Set a floor for channels you're keeping for strategic or learning reasons, even if their current marginal return looks weak.
- Build the initial allocation, including a test budget. Draft the core split across proven channels, then carve out a dedicated slice, often the 10 percent in a 70:20:10 structure, for new channels or creative formats you haven't validated yet. Structured creative testing gives you a framework for sizing that test budget so it produces a real signal instead of noise.
- Set pacing rules and seasonal multipliers. Decide in advance how spend should flex around known peak periods, launches, or slow seasons, rather than reacting to performance dips after the fact.
- Establish governance and a monitoring cadence. Name who owns the reallocation decision, how often the numbers get reviewed, and what narrative you'll use to explain shifts to leadership before you're asked to justify them under pressure.
What Are Typical Channel Allocation Benchmarks?
Benchmarks are a starting point, not a target. The right split depends heavily on whether you're optimizing for direct sales, lead generation, or brand awareness, and on how competitive your local market is.
For a direct-sales or lead-generation objective, a common starting split runs 55 to 65 percent toward high-intent, bottom-funnel channels like search and shopping ads, 20 to 30 percent toward social and display for mid-funnel nurturing, and 10 to 15 percent toward SEO and content as a longer-term efficiency play. For an awareness-first objective, that ratio flips toward video and social, often 40 to 50 percent, with search and direct-response channels dropping to a supporting role.
Digital's share of total ad spend keeps climbing across most industries. In the automotive retail sector specifically, dealers now direct roughly 74.9 percent of ad dollars to digital channels, with search and third-party listing platforms absorbing large shares of that budget. Traditional channels like radio and local print haven't disappeared, but they've been repositioned as reach vehicles for specific local audiences rather than default line items.
| Channel category | Lead-gen focus | Awareness focus |
|---|---|---|
| Search / shopping | 55% | 15–20% |
| Social (paid) | 15–20% | 25–30% |
| Video | 5–10% | 20–25% |
| Display | 5–10% | 10–15% |
| SEO / content | 10–15% | 10–15% |
| Email / owned | 5–10% | 5–10% |
A few adaptation rules matter more than the exact percentages:
- Metro size shifts the mix. Smaller markets often get more value from local reach channels (radio, local social) since national search competition drives up cost per click without a proportional gain in relevant volume.
- Seasonality should override the default split. A category with sharp seasonal demand needs its allocation to flex 20 to 40 percent around peak windows rather than holding a flat monthly budget.
- Never let a channel fall below its learning floor. Even a channel with weak current performance needs enough minimum spend to keep generating data. Cutting it to zero means starting from scratch if you need it again later.
- Audience data should inform, not just channel data. Pew Research's ongoing tracking of platform adoption is worth checking before you lock in a social mix, since platform usage by age and demographic shifts faster than most media plans get updated.
Which Metrics Should Drive Reallocation Decisions?
The metric that should move your budget is marginal return, not average return, and the difference between the two trips up more marketing teams than any other single concept in this framework.

Average ROAS tells you how a channel performed across all the dollars you spent in it. Marginal ROAS tells you how the next dollar would perform if you spent it. A channel can show a strong 4:1 average ROAS while its marginal return on the last 20 percent of spend has collapsed to 1.5:1, meaning you're overfunding it and leaving efficient dollars on the table elsewhere. Marginal-ROAS thinking is the single most actionable lever for rebalancing spend dynamically instead of waiting for a quarterly review to catch the problem.
Your core KPI set should include:
- Marginal iROAS (incremental return on ad spend at the margin) to guide where the next dollar goes.
- CPA or CPL (cost per acquisition or lead) to track efficiency by channel and campaign.
- CAC and LTV together, since a low CAC channel that attracts low-LTV customers isn't actually efficient.
- ACOS (advertising cost of sale) for any e-commerce or marketplace-driven spend.
- Conversion rate by funnel stage to catch attribution distortion before it skews your allocation.
Attribution is where most of this breaks down in practice. Last-click models systematically overcredit bottom-funnel channels like branded search and undercredit the upper-funnel channels, like social and video, that generated the demand in the first place. A dealership CRM integrated with your platform data closes part of that gap by tying actual sales outcomes back to the marketing touchpoints that preceded them, rather than relying on platform-reported conversions alone.
Set a monitoring cadence that matches the decision speed you need:
| Cadence | Focus | Owner |
|---|---|---|
| Daily | Pacing alerts, spend anomalies, platform-level signals | Marketing ops / media buyer |
| Weekly | Tactical reallocation within approved channel budgets | Marketing manager |
| Monthly | Channel-mix review, budget category shifts | Marketing director / CMO |
| Quarterly | Strategic reset, model selection, new channel testing | CMO / finance leadership |
A dashboard built in a platform your team actually checks matters more than which specific tool you choose. The best monitoring cadence in the world fails if the weekly numbers sit unopened in someone's inbox.
How Do You Find Hidden Budget Drains?
Most wasted ad spend doesn't announce itself. It hides in reconciliation gaps, overlapping audiences, and fees nobody has questioned since the vendor contract was signed.
Run this audit sequence quarterly, at minimum:
- Reconcile invoiced spend against platform receipts. Discrepancies between what an agency bills and what the ad platform actually charged are more common than most leaders assume, especially with managed-service arrangements.
- Identify audience overlap across channels. If your retargeting audience on one platform substantially overlaps with your prospecting audience on another, you may be paying twice to reach the same person.
- Flag channels with a high price-per-vehicle-retailed or equivalent cost-per-outcome ratio. A channel that costs disproportionately more per result than the rest of your mix deserves scrutiny even if its raw volume looks healthy.
- Inspect agency and creative production costs separately from media spend. A 15 percent management fee on top of media spend is standard; a 30 percent fee bundled invisibly into "campaign cost" is not.
- Check for third-party listing dependency without a clear ROI case. Recurring subscription-style marketing costs sometimes outlive the performance justification that got them approved.
The root causes tend to repeat across organizations: incomplete CRM integration that prevents true sales attribution, over-reliance on a single third-party platform because switching feels risky, and co-op or manufacturer-funded spend that never gets reconciled against actual results. A dealership-specific audit checklist walks through ten concrete signs that budget is leaking, several of which apply well beyond automotive retail.
Pro Tip: Before you renegotiate a single vendor contract, run the reconciliation step first. Teams that fix attribution and audience overlap before renegotiating fees typically find they need a smaller fee reduction than they expected, because the real waste was in duplication, not price.
The good news: remediation here tends to be fast. Reallocating from a low marginal-return channel, consolidating overlapping reporting tools, and renegotiating a bloated management fee can recover meaningful budget within a single quarter, without asking finance for a single additional dollar.
When Should You Reallocate Mid-Cycle?
Reallocation should be triggered by data, not by anxiety or by a leadership request that arrives with no supporting numbers. Set a clear tolerance threshold in advance so the decision isn't made emotionally in the moment.
- Set a divergence threshold for triggering a shift. A common rule: reallocate when marginal returns between two comparable channels diverge by more than 15 percent over a rolling window, rather than reacting to a single day or week of noisy data.
- Use rolling 4-week pacing, not calendar-month pacing. Calendar months create artificial cliffs (a strong month 1 followed by a weak start to month 2 looks worse than it is). A rolling 4-week view smooths that distortion.
- Apply seasonal multipliers deliberately. Peak months often justify a 1.2x to 1.5x increase over baseline spend, while launch months need a dedicated reserve carved out ahead of time rather than pulled reactively from other channels.
- Size experiment budgets to produce a real signal. A test that's too small to reach statistical relevance wastes the dollars spent on it just as thoroughly as an obviously bad channel. Set a minimum viable test size before you launch, not after you see disappointing early results.
- Use holdout groups to measure true incrementality. Withholding spend from a defined segment lets you measure what the channel actually added, rather than assuming every conversion in a channel would not have happened otherwise.
- Document the reallocation rationale every time. A one-paragraph note explaining what changed and why turns each shift into a defensible decision instead of something that looks arbitrary six months later.
What Do Sample Ad Budget Allocations Look Like?
Concrete numbers make an allocation framework usable. Here's how the model plays out at three different budget sizes, each built around a lead-generation and direct-sales objective.
A $100,000 annual budget (small business or single-location operation) typically runs 50 percent to search, 20 percent to social, 15 percent to SEO and content, 10 percent to a test bucket, and 5 percent reserved as a pacing buffer for seasonal spikes. At this size, the priority is protecting enough spend per channel to generate a usable data signal. Splitting too thin across six or seven channels usually produces noise instead of insight.
A $500,000 annual budget (mid-market or multi-location business) can support a more balanced mix: 40 percent search, 25 percent social, 15 percent video, 10 percent SEO and content, and 10 percent split between testing and a seasonal reserve. This size gives you enough volume to run meaningful holdout tests on at least one channel without disrupting core performance.
A $2 million annual budget (large rooftop group or enterprise marketer) can afford genuine channel diversification: 30 percent search, 25 percent social, 20 percent video, 10 percent display, 10 percent SEO and content, and 5 percent dedicated to ongoing experimentation. At this scale, marginal-return differences between channels become large enough in absolute dollars that weekly rebalancing produces a measurable profit impact.
A simple monthly pacing calculator needs just four inputs: baseline monthly spend by channel, a seasonality multiplier by month, a marginal-ROAS estimate updated from the prior period, and a channel minimum floor. Run those four inputs together and you get a defensible month-by-month plan that leadership can follow without needing to understand the underlying math. Present it as a one-page summary: current allocation, proposed shift, the marginal-return evidence behind the shift, and the expected impact range. That structure answers the three questions every finance leader asks before approving a reallocation.
How Should Dealerships Adapt This Framework?
Dealerships face a version of this problem with sharper edges: thinner margins, heavier reliance on third-party listing platforms, and a metric most other industries don't use at all: per-vehicle retailed, or PVR.

PVR should include every marketing dollar tied to selling a vehicle, not just the platform media spend. That means agency fees, creative production, third-party listing subscriptions, and CRM or attribution tooling all belong in the calculation. Dealership benchmark data puts average PVR spend somewhere between $500 and $722, with the most efficient rooftops operating closer to $250 to $350. NADA's long-standing recommendation of roughly 6 to 7 percent of gross profit toward marketing serves as a useful cross-check against your PVR number, though it shouldn't replace channel-level marginal-return analysis.
A sample dealership allocation for a mid-size rooftop often looks like this: 35 percent to third-party listing platforms (still the dominant lead source for most stores), 25 percent to paid search, 20 percent to social and inventory ads, 10 percent to local reach channels like radio for markets where that still drives showroom traffic, and 10 percent reserved for seasonal pacing. Peak selling months, typically spring and the year-end sales push, often justify pulling from that reserve to increase third-party listing visibility and search coverage when shopper volume is highest. Facebook inventory ads have become a meaningful complement to listing-platform spend for dealers trying to reduce third-party dependency without losing reach.
Local reputation still shapes the top of the funnel in ways paid media alone can't replicate. Word-of-mouth influence remains a real factor in dealership shopping behavior, which is one more reason a pure digital-percentage benchmark undersells the value of local reputation management and review generation as part of the broader spend picture.
High-performing dealership groups don't treat this allocation as fixed even within a season. The most agile rooftops rebalance weekly based on current inventory levels and local competitive shifts, rather than defending a budget built around last year's sales pace. That's the same marginal-return discipline covered earlier in this piece, applied to a business where inventory turns faster than most quarterly budget cycles can react to.
Pro Tip: If your dealership's PVR is climbing but your closing ratio isn't improving, the problem usually isn't the total budget. It's almost always attribution: dollars are getting credited to the wrong channel, which means your reallocation decisions are based on a distorted picture.
AutoROIQ's independent reviews consistently surface this exact pattern: a dealership spending within NADA's recommended range on paper, while a meaningful share of that spend sits in channels with weak or unmeasured marginal return, once vendor-reported numbers are checked against actual sales outcomes.
A Practical Note on Getting This Right
Most of the allocation mistakes covered in this piece are not intelligence failures. They're structural ones. A marketing manager tasked with hitting a quarterly lead target rarely has the authority, or the incentive, to pull budget from a channel finance approved six months ago, even when the marginal-return data says it should happen.
That's where governance matters as much as the math. Someone needs clear ownership of the reallocation decision itself, distinct from ownership of individual channel execution. In most organizations that's a marketing director or CMO working directly with finance, with marketing ops responsible for surfacing the marginal-return data on a cadence fast enough to act on. When that ownership is unclear, budgets default to the safest option: leave it where it was, because nobody wants to be the person who moved money away from a channel that later had a good month.
The clients who get the most value from a framework like this aren't the ones with the most sophisticated attribution stack. They're the ones who've simply agreed, in advance, on who gets to say "move the money" and how often that conversation happens. Everything else in this framework is easier once that's settled.
Getting an Objective Read on Your Marketing Mix
Building the framework above is one thing. Trusting the numbers behind it is another, especially when every vendor in your marketing mix is reporting their own channel as the top performer. Autoroiq exists for exactly that gap: an independent review of your marketing spend that doesn't sell advertising and has no channel to defend.

If your vendor landscape has grown complex, your attribution feels inconsistent across platforms, or your per-vehicle marketing cost is climbing without a clear performance story to explain it, that's usually the point where an outside, vendor-agnostic review pays for itself. Autoroiq's performance reviews and vendor accountability scorecards give dealership leaders a defensible, data-backed picture of where budget is working and where it isn't, without a sales pitch attached to the findings. Visit AutoROIQ's advisory services to start a conversation about what an independent marketing review would look like for your rooftop.
Frequently Asked Questions
What percentage of revenue should a company spend on advertising? There's no universal figure, since the right share of revenue depends on your industry, growth stage, and margin structure. Statista's cross-industry tracking is a reasonable starting benchmark, but it should be adjusted using objective-based or marginal-return analysis rather than applied as a flat rule.
How often should you reallocate ad budget? Review tactical performance weekly, revisit the broader channel mix monthly, and reserve full strategic resets for quarterly planning. Reallocate sooner if marginal returns between two channels diverge by more than roughly 15 percent over a rolling window.
What's the difference between average ROAS and marginal ROAS? Average ROAS measures the return across all dollars spent in a channel. Marginal ROAS measures the return on the next dollar you would spend. A channel can show strong average ROAS while its marginal return has already dropped below the point where more spend makes sense.
How much should a dealership spend on marketing per vehicle? Dealership benchmarks put average per-vehicle marketing spend between roughly $500 and $722, with efficient dealers closer to $250 to $350. NADA's guidance of 6 to 7 percent of gross profit serves as a useful secondary check.
What is the 70:20:10 budgeting rule? It allocates 70 percent of spend to proven, reliable channels, 20 percent to channels showing promise that need more data, and 10 percent to experimental or emerging tactics, building ongoing testing directly into the budget structure.
Sources
- How to Create a Digital Marketing Budget: 4 Considerations
- Statista — share of marketing budgets relative to revenue
- Pew Research Center — social media fact sheet
- Budget allocation across Meta, Google, and TikTok | Cresva