
The fastest way to compare marketing agencies objectively is a weighted, anchored scorecard rather than a gut-feel pitch ranking. Download the editable scorecard template below: it contains a scoring matrix, written 1–5 anchors, a weighting and pricing-normalization calculator, and a decision checklist for the final round. Fill it in during pitches, not after, and you walk away with a defensible recommendation instead of a hunch.
TL;DR:
- Using a weighted, anchored scorecard during pitches ensures a consistent, objective comparison rather than relying on gut feelings or impressions.
- Written anchors clarify evaluation standards, reducing subjective differences on dimensions such as proof density, pricing clarity, and pipeline attribution.
- Normalizing proposal costs to a year-one figure prevents lower upfront prices from unfairly skewing the comparison.
- Red flags like lack of a named team or inability to tie spend to results should disqualify agencies regardless of their scores.
- Tailoring the criteria weights to the project's priorities and locking them before pitches avoids biased or hindsight adjustments.
Table of Contents
- What's Inside the Agency Scorecard Template
- What Dimensions Should You Score, and What Do the Anchors Look Like?
- How Do You Run the Selection Process With the Scorecard?
- How Do You Weight Criteria and Normalize Pricing Fairly?
- What Red Flags Should Disqualify an Agency Regardless of Score?
- How Should Dealerships Adapt the Scorecard?
- Why Vibe Hiring Still Wins, and How to Stop It
- Sources
What's Inside the Agency Scorecard Template
The download is a single Excel workbook with a printable PDF companion, built so a procurement lead can hand it to a committee without a walkthrough call. Each sheet has one job.
- Scoring Matrix: rows for each shortlisted agency, columns for each dimension, with auto-summed weighted totals.
- Anchors sheet: written definitions of what a 1, 3, and 5 actually look like for every dimension, so two evaluators scoring the same pitch land within a point of each other.
- Weighting sheet: lets you assign percentage weights that sum to 100 and recalculates totals live as you adjust priorities.
- Instructions tab: a one-page walkthrough of the scoring and pricing-normalization process.
- Decision checklist: the reference-call questions and paid-pilot terms you'll use in the final round.
Enter shortlisted agencies in the matrix as columns, not rows. That layout makes it easier to eyeball differences dimension by dimension rather than scrolling agency by agency. The anchors sheet is the piece most teams skip and most regret skipping. Without it, one evaluator's "4" for strategic depth is another's "2," and the weighted total becomes noise dressed up as data. Column Five's B2B content marketing agency scorecard builds its anchors around specific, checkable evidence, and this template borrows that structure. The pilot and contract checklist sits on its own tab at the end, separate from the scoring matrix, because kill criteria should never be averaged into a score.
What Dimensions Should You Score, and What Do the Anchors Look Like?
Eight dimensions cover most agency evaluations without turning the matrix into a 40-row slog: strategic depth, ICP or vertical fit, full-format production capability, proof density, pricing clarity, team composition, pipeline attribution, and AI/tech readiness.
Anchors matter more than the list itself. A vague "rate their case studies 1 to 5" invites five different interpretations across a buying committee. Written anchors close that gap.
- Proof density. A score of 1 means the agency shows logos with no results attached. A 5 means ten or more case studies with named clients, dated results, and revenue or pipeline attribution, not just impressions or engagement.
- Pricing clarity. A 1 is a one-line retainer number with no scope breakdown. A 5 itemizes deliverables, hours, media markup, and change-order rates in writing, before you ask.
- Pipeline attribution. A 1 relies on last-click platform dashboards with no tie to closed revenue. A 5 shows cohort-level or deal-level tracking connecting a specific campaign to a specific sale.
The B2B content marketing agency scorecard uses this same anchor logic across its dimensions, and the Setup agency selection scorecard applies a similar standard around pitch quality and partnership potential.
Pro Tip: Cut dimensions that don't apply to your project rather than scoring them out of obligation. A five-person startup evaluating a single-channel retainer doesn't need a full-format production score; a national retailer running an integrated campaign probably does.
How Do You Run the Selection Process With the Scorecard?
Run the scorecard in three phases so scoring happens in real time, not from memory a week after the pitches end.
- Before proposals arrive: shortlist three to five agencies, share the dimensions and written anchors with each bidder in advance, and lock your weights before you see a single deck. Weighting after you've fallen for a proposal defeats the purpose.
- During the pitch: score live, in writing, on the spot. Assign anchors, not gut impressions, and jot the specific evidence that justified each number (the client name behind a proof-density 5, the line item behind a pricing-clarity 4).
- After scoring closes: normalize every proposal's pricing to a year-one cost, run the decision round (references and a paid pilot), and record the winning score alongside a one-line rationale tied to your highest-weighted dimension.
THAT Agency's marketing agency selection scorecard frames this as scoring the way a CFO would evaluate any major capital decision: on paper, with weights fixed in advance, and with a documented rationale a finance committee can review later without re-litigating the whole pitch.
Pro Tip: Write the one-line rationale before the meeting ends. "Agency B won on pipeline attribution (30% weight) and pricing clarity, despite a weaker creative pitch" survives a CFO's questions far better than "everyone just liked them."
How Do You Weight Criteria and Normalize Pricing Fairly?
Weights should sum to 100 across all dimensions, with three or four priority dimensions carrying noticeably more weight than the rest. An early-stage brand might weight strategic depth and team composition heaviest; a scaling company leans toward production capability and pricing clarity; an enterprise buyer weights attribution and governance hardest, an approach Column Five's scorecard guidance recommends tying explicitly to business stage.
Pricing normalization is where most comparisons break down, because a $10,000/month retainer and a per-asset pricing model aren't comparable on their face.
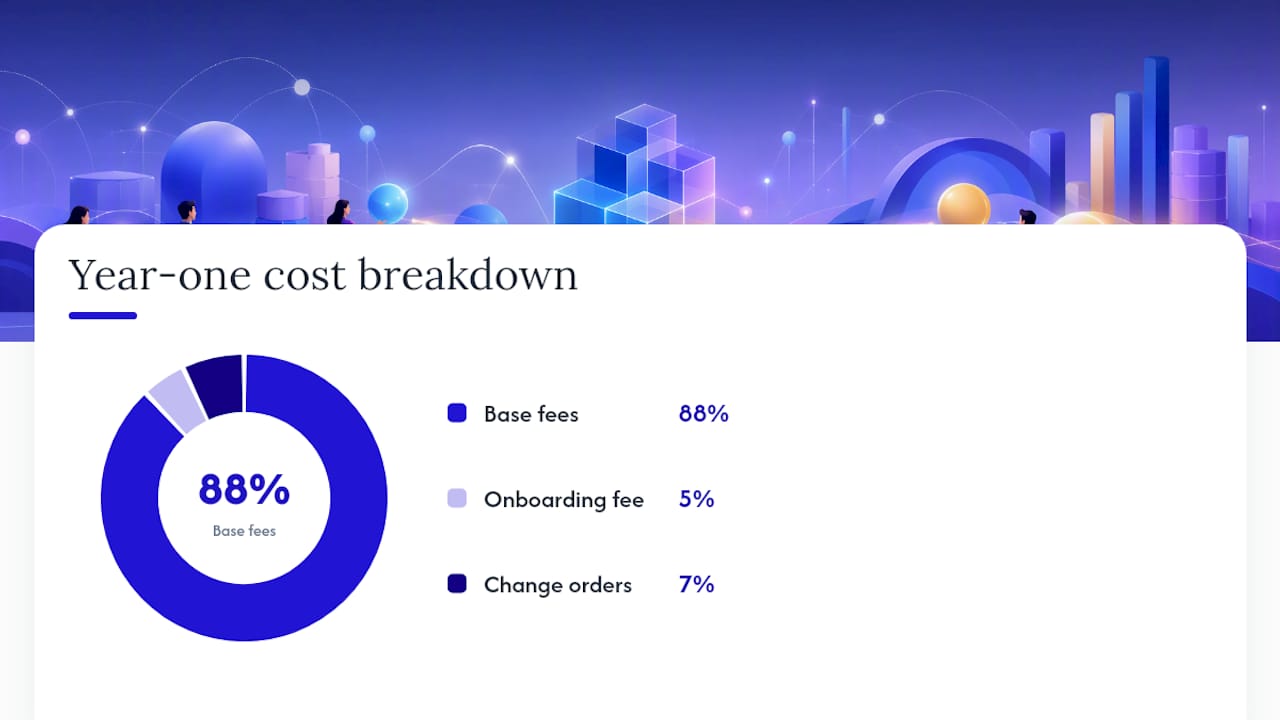
- Convert every proposal to a loaded year-one cost: base fees, onboarding, software or licensing pass-throughs, and typical change-order or rush-fee rates.
- An $8,000/month retainer becomes $96,000 plus a $5,000 onboarding fee and an estimated $8,000 in likely change orders, for a $109,000 year-one figure.
- A per-asset model quoting $1,200 per landing page needs an estimated annual volume applied before it can sit next to that retainer number.
Setup's agency selection scorecard recommends this same normalize-to-year-one approach specifically so a lower headline rate doesn't quietly win on an incomplete number.
What Red Flags Should Disqualify an Agency Regardless of Score?
Some issues should zero out an otherwise strong score rather than get averaged into it. Treat these as gate filters, scored separately from the weighted matrix, not blended into it.
- No named delivery team, only sales and account leadership, in the pitch.
- Reporting that can't tie a dollar of spend to a dollar of pipeline when asked directly.
- Vague or evasive answers about past client departures.
For reference calls, ask two questions every time: "What would you change about working with them?" and "Why did their last comparable client leave?" Evasive answers here matter more than a polished deck. For the paid pilot, keep it to two to four weeks, one clearly scoped deliverable, and one measurable success metric agreed before work starts, a structure both Column Five and independent vendor assessment checklists recommend as a way to test execution rigor before signing anything longer.
How Should Dealerships Adapt the Scorecard?
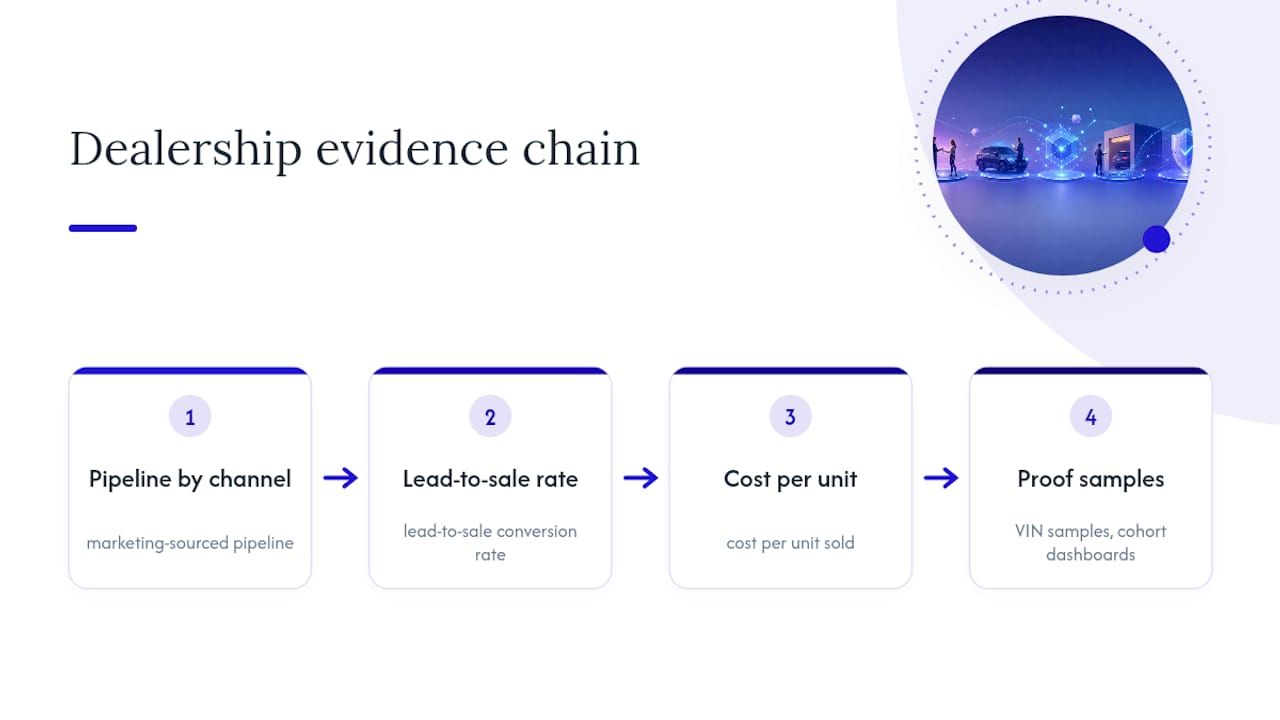
Dealership marketing evaluations need one adjustment: weight attribution and reporting transparency higher than creative polish. A vendor's dashboard showing impressions and click-through rate tells you almost nothing about whether a campaign sold a unit off the lot.
Add dealership-specific rows to the proof-density and attribution dimensions: marketing-sourced pipeline by channel, lead-to-sale conversion rate, and cost per unit sold rather than cost per lead. Where the anchors sheet asks for evidence, request VIN-level tracking samples or cohort-to-sale dashboards, not platform screenshots. Our own dealership agency KPI guide breaks down which of these numbers actually move gross profit, and our agency selection guidance covers what evidence to demand before you sign.
Why Vibe Hiring Still Wins, and How to Stop It
Vibe hiring survives because a confident pitch deck is easier to evaluate in the room than a spreadsheet is to build in advance. Scorecards force the opposite: criteria and weights get set before anyone sees a slide, which is uncomfortable and exactly the point.
Three moves fix most broken evaluations: lock weights before the first pitch, write anchors before you score anything, and separate red flags from the numeric total entirely. If your dealership needs the attribution evidence adapted further, our executive dashboard framework and AutoROIQ's advisory team can walk through a vendor-agnostic review built around your actual numbers.
— AutoROIQ
Sources
- The B2B Content Marketing Agency Scorecard template (PDF)
- Marketing Agency Selection Scorecard - THAT Agency
- Agency Selection Scorecard - Setup