
Audience overlap analysis measures how many individuals appear in two or more vendor audiences simultaneously, giving dealership executives a direct, data-driven test of whether each vendor is delivering net-new reach or recycling the same prospects you are already paying another vendor to reach. The immediate action: request exact-match audience exports (hashed emails, phone SHA-256, or hashed phone numbers) from every active vendor and your CRM this week. Autoroiq applies this same methodology as part of its vendor-agnostic audits, using Jaccard similarity and pairwise overlap tables to produce defensible vendor scorecards. Research from the NBER confirms that audience overlap functions as a reliable, low-cost proxy for diversion ratios, meaning you can measure incremental vendor value without commissioning expensive consumer surveys.
Table of Contents
- What decisions does audience overlap analysis actually enable?
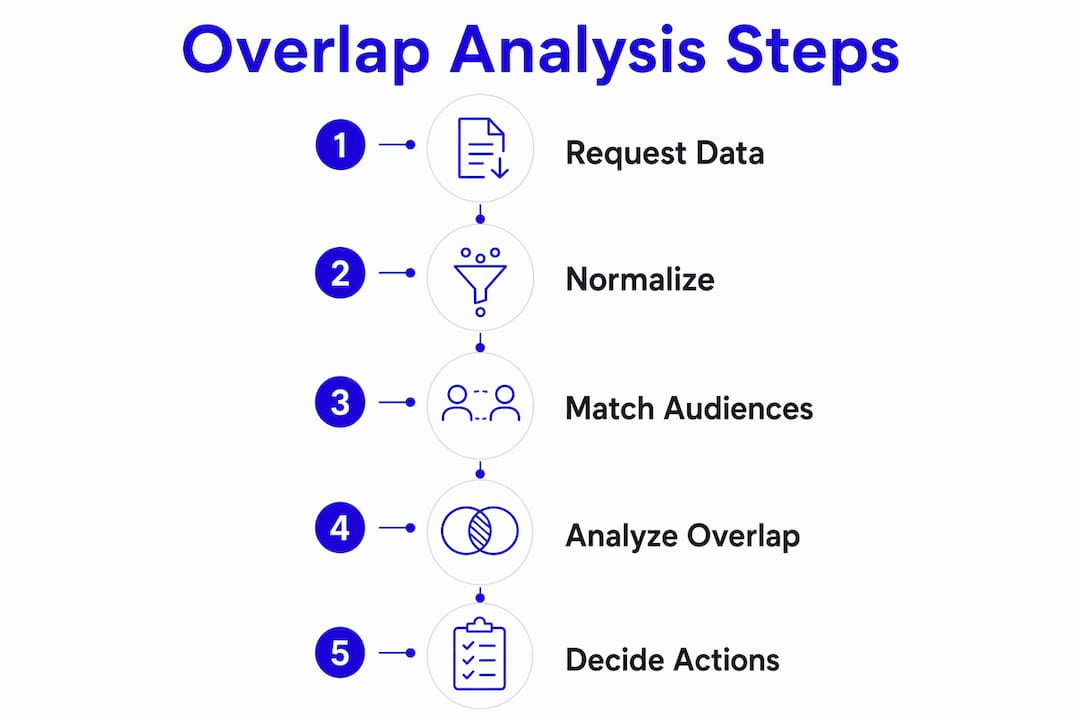
- The four-step process for running audience overlap analysis
- Core metrics, formulas, and a worked example
- How to match audiences reliably and protect data quality
- How to read overlap results and what to do next
- Building a dashboard you can have running this month
- When should you hire an independent auditor?
- How Autoroiq conducts audience overlap analysis
- Key Takeaways
- The solus buyer trap is where most consolidation decisions go wrong
- Autoroiq's independent audit puts defensible numbers behind your vendor decisions
- Useful sources
What decisions does audience overlap analysis actually enable?
Running this analysis produces four concrete decisions, not just a report. First, you can consolidate or terminate vendors whose audiences duplicate your CRM or another vendor's reach above a defensible threshold. Second, you can renegotiate rates with vendors who show high overlap, because their marginal contribution to net-new reach is provably lower. Third, you can reassign budget to channels that reach audiences your current mix does not touch. Fourth, you can design small A/B incrementality tests before making any large budget cuts, protecting against false positives.
Executive success looks like this: measurable incremental reach per channel, a documented reduction in duplicate spend, preserved solus buyers (customers reachable only through one vendor), and a vendor scorecard you can defend to ownership. These outcomes connect directly to cost per sale and marketing ROI, the two financial KPIs that matter most at the dealership P&L level.
The four-step process for running audience overlap analysis
Exact customer matching is the most precise method available. Here is the repeatable playbook:
-
Data collection. Request hashed email (SHA-256), hashed phone (SHA-256), and zip code from each vendor. Ask for a flat-file export (CSV or JSON) covering the same 90-day window across all vendors. Pull the same identifiers from your DMS or CRM. Mismatched time windows are the single most common reason overlap numbers look artificially low.
-
Segmentation. Divide each export into 3–8 clear segments before matching: high-value buyers (purchased within 12 months), recent prospects (last 90 days), conquest targets (no prior purchase), and geography-based clusters. Keeping segments tight makes the overlap numbers interpretable. Audience segmentation research confirms that homogeneous subgroups produce more precise measurement than undifferentiated lists.
-
Measurement. Run pairwise comparisons across every vendor pair within each segment. Prefer exact/deterministic matching on hashed identifiers. When exact identifiers are unavailable, fall back to segment-level composition matching and document the assumption explicitly. Use suppression lists from overlap results to prevent prospecting ads from serving to existing customers.
-
Interpretation. Apply decision thresholds to each pairwise result. Under 20% overlap signals genuine new reach. Between 20% and 60% warrants a closer look at solus buyers and cost efficiency. Above 60% is a red flag for budget duplication and should trigger a renegotiation or consolidation review.
Core metrics, formulas, and a worked example
Three core metrics appear in every reliable overlap dashboard: Overlap Count, Overlap Percentage, and Total Unique Audience. Jaccard Similarity normalizes overlap across audience sizes, making it the right metric when comparing vendors of different scale.
Formulas:
- Overlap Count = |A ∩ B| (individuals in both audiences)
- Overlap % (A→B) = |A ∩ B| / |A| × 100
- Overlap % (B→A) = |A ∩ B| / |B| × 100
- Total Unique Audience = |A ∪ B| = |A| + |B| − |A ∩ B|
- Jaccard Similarity = |A ∩ B| / |A ∪ B|
Jaccard matters because a 5,000-person overlap looks very different when Vendor A has 6,000 members versus 60,000. The raw percentage alone can mislead; Jaccard normalizes it.
Worked example:
| Metric | Value |
|---|---|
| Overlap % (A→B) | 60% |
| Jaccard Similarity | — / 15,200 = 0.32 |
A Jaccard of 0.32 with a 60% overlap from Vendor 1's perspective means Vendor 1 is reaching a largely duplicated audience. Before cutting Vendor 1, check its solus buyer count: if a meaningful share of its 3,200 non-overlapping members are active buyers, terminating the vendor costs real sales.
Key insight: High overlap offers cross-sell simplicity but limits access to new customers and signals potential pay-duplication across vendors.
How to match audiences reliably and protect data quality
Exact/deterministic matching on hashed identifiers is the gold standard. SHA-256 hashing of lowercase-normalized emails and E.164-formatted phone numbers before export protects raw PII while enabling precise matching. Never request raw PII over email or an unsecured file-sharing channel.

When exact identifiers are unavailable, affinity and compositional overlap are useful fallbacks, but they measure different things. Affinity signals suggest that two audiences share behavioral or demographic characteristics; they do not prove the same individuals are being reached. Document which method you used in every report so results are reproducible.
Data quality checks to run before any matching:
- Deduplicate records within each export (same hashed ID appearing twice inflates audience size)
- Normalize email casing and phone format before hashing
- Confirm all exports cover the same calendar window
- Flag any segment with fewer than 500 matched records as statistically unreliable
For U.S. dealerships, follow applicable state privacy laws (California Consumer Privacy Act, Virginia Consumer Data Protection Act) and each platform's terms of service. Audience data shared for overlap analysis should be governed by a data processing agreement with each vendor.
Pro Tip: Send vendors a one-page data request template specifying: SHA-256 hashed email, SHA-256 hashed phone, zip code, segment label, export date range, and row count. Vendors who cannot or will not provide this format are a data quality risk worth flagging in your vendor scorecard.
How to read overlap results and what to do next
Practical decision bands for pairwise Jaccard scores:
- Below 0.20 (low overlap): The vendor is reaching a largely distinct audience. Preserve the channel and monitor solus buyer count quarterly.
- 0.20–0.60 (moderate overlap): Investigate solus buyers before acting. Run a 60-day incrementality test before cutting budget. Check whether the vendor's cost per sale justifies the duplication.
- Above 0.60 (high overlap): Strong signal of budget inefficiency. Initiate consolidation review, build exclusion audiences for prospecting, and open renegotiation with documented overlap data.
Red flags that require immediate attention: high overlap across three or more vendors simultaneously, a vendor whose solus buyer count is under 5% of its total audience, and sample windows that do not align across vendor exports (a common tactic that makes overlap appear lower than it is).
The recommended reporting cadence is monthly for active vendor reviews and quarterly for contract renegotiations. Overlap above 60% on two consecutive monthly reports is a procurement trigger, not just a data point. For more signs your current vendor mix may be wasting budget, see Autoroiq's dealership marketing waste indicators.
Building a dashboard you can have running this month
Workflow (assign owners before you start):
A vendor manager requests exports from each vendor by the 5th of each month. A marketing analyst ingests and normalizes the files by the 8th. Matching runs by the 10th, and the GM or marketing director reviews results by the 15th. Any Jaccard score above 0.60 triggers a vendor call within five business days.
Dashboard field spec:
| Field | Description |
|---|---|
| audience_id | Unique identifier for each vendor audience |
| audience_name | Vendor and segment label |
| member_count | Total records in the audience after deduplication |
| overlap_count | Matched records between this audience and each comparison audience |
| overlap_pct_a | Overlap Count / audience A member count × 100 |
| overlap_pct_b | Overlap Count / audience B member count × 100 |
| jaccard | overlap_count / (member_count_a + member_count_b − overlap_count) |
Required dashboard widgets: pairwise overlap table, net-new reach by channel, Jaccard heatmap, solus buyer count per vendor, and a sample-size flag for any segment under 500 records. Power BI and Tableau both support this spec; for a comparison of which fits dealership reporting workflows better, see Autoroiq's Power BI vs. Tableau guide.
When should you hire an independent auditor?
Three situations make an independent audit the right call. First, when vendor spend is high and incremental reach is unclear despite internal analysis. Second, when two or more vendors submit reports that contradict each other on audience size or overlap. Third, when a multi-vendor consolidation is on the table and the financial stakes require defensible, third-party-verified numbers.
A credible independent audit should deliver:
- Raw-match verification with reproducible scripts (not just a summary PDF)
- Methodology documentation that a second analyst could replicate independently
- A vendor-agnostic scorecard ranking each vendor on net-new reach, solus buyer count, cost per incremental sale, and data quality
- An executive briefing with specific budget reallocation recommendations, not generic observations
When evaluating prospective auditors, request a sample scorecard, ask how they handle vendors who refuse to export hashed identifiers, and confirm they have no commercial relationship with any vendor in your current mix. For broader criteria on selecting external marketing partners, Autoroiq's agency selection guide covers the key questions to ask.
How Autoroiq conducts audience overlap analysis
Autoroiq's methodology is vendor-agnostic by design. Every engagement starts from the same data request sent to all vendors simultaneously, using identical hashing standards and the same export window. This eliminates the most common source of vendor-report discrepancies before analysis begins.
The analysis covers three overlap dimensions: identity overlap (exact deterministic matching), compositional overlap (segment-level demographic and behavioral similarity), and net-new reach (audience members unreachable through any other active vendor). Each vendor receives a scorecard ranking performance on all three dimensions, along with a cost-savings estimate tied to the dealership's actual spend data.
Autoroiq's vendor-agnostic scorecards give dealership executives a single, reproducible document they can bring to a vendor renegotiation or a board-level budget review. The methodology is designed so that any qualified analyst can replicate the matching results from the raw exports, making the findings defensible under scrutiny.
Key Takeaways
Audience overlap analysis is the most direct, low-cost method dealership executives have to test whether each vendor is delivering incremental reach or duplicating spend already covered by another channel.
| Point | Details |
|---|---|
| Request hashed exports first | Ask every vendor for SHA-256 hashed emails and phones covering the same 90-day window before running any analysis. |
| Use Jaccard to normalize | Jaccard Similarity (overlap / union) corrects for vendor size differences that raw overlap percentages obscure. |
| Protect solus buyers | A vendor with low overall overlap may still deliver unique buyers; verify solus buyer count before cutting any channel. |
| Act at 60%+ Jaccard | Overlap above 0.60 on two consecutive monthly reports is a procurement trigger for consolidation or renegotiation. |
| Autoroiq for independent validation | Autoroiq's vendor-agnostic scorecards provide reproducible, third-party-verified overlap results for executive and board-level decisions. |
The solus buyer trap is where most consolidation decisions go wrong
The conventional wisdom on high overlap is straightforward: if two vendors are reaching the same people, cut one. That logic is correct often enough to be dangerous when it is wrong.
The real risk is the solus buyer, the customer who appears in only one vendor's audience and nowhere else in your mix. A vendor with a Jaccard of 0.65 looks redundant on a heatmap. But if 15% of that vendor's audience are active in-market buyers who do not appear in any other export, terminating the contract costs you those sales with no replacement channel in place. The overlap number alone does not tell you that.
The behavioral change executives should demand from vendors is not just lower overlap. It is regular, standardized exports with documented sample sizes, reproducible matching scripts, and a clear accounting of solus buyers in every report. Vendors who resist that level of transparency are, in practice, asking you to trust their self-reported performance numbers without verification. That is not a data quality issue. It is a vendor accountability issue.
Autoroiq's independent audit puts defensible numbers behind your vendor decisions
Dealerships that run overlap analysis in-house often hit the same wall: vendors who provide inconsistent exports, internal teams without the bandwidth to run monthly matching, and results that are hard to defend in a contract renegotiation. Autoroiq was built specifically to solve that problem for franchise automotive dealerships.

A typical Autoroiq engagement covers data intake and normalization, deterministic matching across all active vendors, a pairwise Jaccard heatmap, solus buyer counts, and a vendor scorecard with specific budget reallocation recommendations. The deliverable is an executive briefing your GM, CFO, or ownership group can act on immediately, not a 60-page methodology document.
One-time audits and recurring monthly advisory engagements are both available. If you are spending more than $30,000 per month across multiple vendors and cannot clearly state which one is delivering net-new buyers, an independent review will pay for itself in the first renegotiation cycle. Request an independent marketing review from Autoroiq to get started.
Useful sources
- NBER working paper on customer overlap and diversion ratios: The academic foundation for using audience overlap as a proxy for incremental reach and competitive substitution. Essential reading for executives who need to defend the methodology to ownership or legal.
- ClearlyAcquired: How to Analyze Customer Base Overlap: Practical walkthrough of the four-step process and the case for exact matching over segment-level fallbacks.
- Zeotap Audience Overlap Documentation: Source for the three core metric definitions (Overlap Count, Overlap Percentage, Total Unique Audience) and suppression list use cases.
- Felton Blog: Audience Overlap Measurement: Clarifies the distinction between affinity overlap and identity overlap, a common source of executive confusion.
- Similarweb: Analyze Audience Overlap: Dashboard design reference for pairwise overlap tables, unique visitor counts, and audience loyalty metrics.
- Semrush Audience Overlap Dashboard Manual: Visual design guidance for pairwise overlap tables and potential audience widgets.
- Autoroiq Marketing Intelligence: Autoroiq's full library of vendor accountability and budget optimization analysis for automotive dealerships.