
Cost per vehicle sold, not cost per lead, is the benchmark that should decide where your marketing dollars go in 2026. But the number that actually predicts profitability is what each vehicle sold costs you to market, and how well fixed ops and F&I absorb overhead once that vehicle leaves the lot.
TL;DR:
- Dealerships should prioritize measuring the actual cost per vehicle sold, which includes understanding lead-to-sale conversion rates and overhead absorption.
- Google search remains the most valuable digital channel, with a good CPL under $30 and CPC below $1.20, especially for non-branded search terms.
- Fixed ops and F&I performance are critical in measuring marketing effectiveness, as retaining customers for service greatly increases lifetime value.
- Relying solely on last-click attribution distorts actual marketing ROI, so implementing multi-touch, VIN-based attribution offers a clearer picture of demand-generation.
- Independent benchmarks and audits are essential to accurately evaluate performance, as vendor reports often overstate success and lack context against peer groups.
Table of Contents
- What Are the Current Dealership Marketing Benchmarks?
- Digital Channel Benchmarks: Search, Paid Social, and Display
- Cost Per Vehicle and Spend Per Store: Why Fixed Ops Changes the Math
- The KPI Dashboard Dealers Must Run Daily
- SEO and GEO Benchmarks That Actually Move Showroom Traffic
- How to Use Benchmarks Responsibly
- A 5-Step Checklist to Apply This Quarter
- Benchmark Comparison by Dealership Size and Type
- Industry Average Benchmarks Over Recent Periods
- CAC and LTV Benchmarks Specific to Dealerships
- Attribution Model Benchmarks and Multi-Touch Effectiveness
- Social Media Engagement Benchmarks Beyond CPC and CPL
- Traditional Marketing Channel Benchmarks: Radio, TV, and Direct Mail
- AutoROIQ Perspective: What Benchmarks Mean Without a Vendor's Thumb on the Scale
- Get an Independent Read on Your Marketing Spend
- Sources
- FAQ
What Are the Current Dealership Marketing Benchmarks?
Dealership marketing benchmarks fall into two categories that too many marketing directors treat as one. The first category is channel performance: click costs, click-through rates, and cost per lead by platform. The second is business outcome: cost per vehicle sold, advertising spend per store, and fixed-ops absorption. Confusing the two is the most common reason a dealership's marketing report looks healthy while gross profit erodes.
The channel numbers are useful because they're standardized and easy to compare across vendors. Dealers United's Q2 2026 Standards of Excellence put Google Ads CPC at $1.10 to $1.20 with click-through rates between 2.8% and 3%, and set a cost per lead under $30 as the "good" grade for search. Those figures work as a sanity check on vendor invoices. They don't tell you whether the leads you're buying turn into gross profit.
That's where advertising cost per vehicle sold comes in. Benchmark data compiled by Get X Media puts advertising cost per new vehicle sold in the range dealers should be measuring against directly, rather than inferring it from CPL alone. A store spending $28 per lead but converting at half the rate of a competitor can easily end up with a higher real cost per vehicle. Automotive marketing metrics only mean something when you connect them to units on the ground, not clicks in a dashboard.
The shift dealership performance indicators are forcing onto marketing leaders is simple to state and hard to execute: stop grading campaigns on lead volume and start grading them on vehicles sold and gross retained after the sale. The rest of this piece walks through the specific bands, the KPI dashboard that supports that shift, and a checklist you can run this quarter.
Digital Channel Benchmarks: Search, Paid Social, and Display
Google Search remains the highest-intent channel for in-market shoppers, which is why its benchmarks set the tone for everything else. The $1.10 to $1.20 CPC and 2.8% to 3% CTR figures from Dealers United apply best to non-branded search terms like "new [model] near me." Branded searches for your own dealership name should run cheaper and convert higher; if they don't, your Google Business Profile or site experience likely has a problem search spend can't fix.
Paid social tells a more varied story by platform:
- Meta (Facebook/Instagram) typically produces the lowest cost per lead of the major social platforms, largely because its targeting and creative formats are the most mature for automotive inventory ads.
- TikTok runs the highest cost per lead and cost per sale among the platforms Dealers United tracked, reflecting a younger, lower-intent audience that needs more nurturing before a purchase decision.
- Pinterest, Snapchat, and Reddit sit in between, with performance that depends heavily on whether your creative matches the platform's native content style rather than looking like a repurposed TV spot.
Grading bands to apply against your own numbers: a search CPL under $30 is good, $30 to $45 is acceptable but worth monitoring, and above $45 warrants a creative or landing-page audit before you cut budget. For CPC, anything at or below the $1.10 to $1.20 range is on benchmark; paying $1.75 or more on non-branded search terms usually points to a Quality Score problem or an overly broad keyword match type.
Translating cost per lead into cost per vehicle requires one more variable: your lead-to-sale conversion rate. Run that math for every channel before deciding where to add or cut budget. A channel with a slightly higher CPL but a meaningfully better conversion rate can still deliver a lower cost per vehicle than your cheapest lead source.
Pro Tip: *Pull your CRM's lead-to-sale rate by source, not just overall.
Measurement caveats matter here. Channel intent differs (search captures active shoppers, social interrupts passive browsers), creative quality swings results by platform, and inventory alignment (advertising a vehicle you don't have in stock) inflates cost per lead without you realizing why. Last-click attribution also tends to overcredit whichever channel closes the loop, even when an earlier touchpoint did the real work. A multi-touch attribution approach corrects for some of this distortion, though no model is perfect.
Cost Per Vehicle and Spend Per Store: Why Fixed Ops Changes the Math
Cost per vehicle sold is the metric that forces marketing and sales to share accountability. If your total marketing spend for a month was $45,000 and you retailed 90 units, your blended cost per vehicle is $500. Benchmark ranges for advertising cost per new vehicle sold, compiled by Get X Media, give you a directional target to compare that number against by store type and market, rather than guessing whether $500 is good or bad in isolation.
Calculating it channel by channel follows a simple formula:
- Take the channel's cost per lead.
- Divide by that channel's lead-to-sale conversion rate.
- Adjust for the share of those leads that would have converted anyway through another channel, if you can estimate it.
Compare that figure against your blended average and against the benchmark band, then decide whether to scale or trim.
Fixed ops and F&I change the calculation because they're where a marketing dollar keeps paying you back. A vehicle sold at breakeven gross but retained for service over three years is a very different outcome than a vehicle sold at breakeven gross that never returns. Service absorption, the percentage of fixed overhead covered by parts and labor gross, is the number that tells you whether retention marketing is worth funding at the same level as conquest campaigns. Cross-industry retention benchmarks from Statista reinforce why: keeping an existing customer costs a fraction of acquiring a new one, and that gap widens further in a category with long ownership cycles like automotive.
Pro Tip: When a channel's cost per vehicle sits within your benchmark band but service absorption is flat, the problem usually isn't marketing. It's that your service department isn't converting the customers marketing is already sending. Fix the handoff before you touch the budget.
As a rule of thumb: a channel running at or below your benchmark cost-per-vehicle band and feeding measurable service retention deserves more budget. A channel above the band with no retention signal is a candidate to cut, not just optimize.
The KPI Dashboard Dealers Must Run Daily
Fifteen metrics show up consistently across dealership performance frameworks, and the Voltra KPI dashboard model organizes them into a set every marketing director should have visibility into, not just the general manager.
- Sales: front-end gross per unit, retail units sold, days to sale, closing ratio.
- F&I: products per deal, F&I gross per retail unit, penetration rate.
- Inventory: inventory turn rate, aging inventory percentage, days supply, cost-to-market.
- Fixed ops: service absorption rate, effective labor rate, hours per repair order, parts-to-labor ratio.
Some of these are lead indicators and some are lag indicators, and mixing them up is a common mistake. Cost-to-market, days supply, and products per deal move fast and tell you something is wrong before revenue drops. Front-end gross per unit and closing ratio are lag indicators; they confirm a problem after it's already cost you money. Voltra's research found that top-performing stores prioritize lead indicators roughly 70% of the time specifically so they can redirect budget weekly instead of waiting for a monthly report to confirm what already happened.
| KPI | Type | Review cadence |
|---|---|---|
| Cost-to-market | Lead | Weekly |
| Days supply | Lead | Weekly |
| Aging inventory % | Lead | Weekly |
| Closing ratio | Lag | Monthly |
| Front-end gross per unit | Lag | Monthly |
| Service absorption | Lag | Monthly |
| Products per deal | Lead | Weekly |
The dollar impact of small KPI moves is easy to underestimate. A store retailing 100 units a month at a $1,800 average front-end gross generates $180,000. Improve closing ratio by just one percentage point on the same lead volume, and you're adding units without adding a dollar of extra ad spend, since the leads were already paid for. That's the argument for connecting your CRM, DMS, and marketing analytics into one dashboard: a KPI improvement that shows up in isolation as "one more sale" often traces back directly to a specific process fix, not luck.
SEO and GEO Benchmarks That Actually Move Showroom Traffic
Ranking on page one for your own backyard cities, the towns within roughly a 15 to 20 mile radius where most of your actual buyers live, matters more than chasing national keyword volume. A dealership that dominates local search in five nearby towns will out-convert one ranking loosely across an entire metro area, because backyard-city traffic already has geographic intent to buy nearby.
Track these signals monthly rather than treating SEO as a set-and-forget project:
- Impression growth per page, tracked in Google Search Console, is the earliest signal that new content or a technical fix is working, often weeks before it shows up in traffic or leads.
- Keyword-cluster movement, not single-keyword rank, tells you whether you're gaining authority across a topic (say, "certified pre-owned SUV" variants) rather than getting lucky on one term.
- AI visibility and share-of-voice are becoming as important as traditional rank. A reasonable target is appearing in AI-generated answers (ChatGPT, Perplexity, AI Overviews) for at least half of your core buyer queries, with a share-of-voice at or above 30% against nearby competitors mentioned in the same answers.
Measuring AI visibility takes a manual sampling method for now: run 15 to 20 realistic buyer prompts ("best Honda dealer near [city]," "where to buy a certified [model] near [city]") through the major AI tools monthly and log whether and how you're mentioned. A local rank tracker can automate the backyard-city portion of this tracking, though AI-answer sampling still requires a human doing the querying.
Pro Tip: Impression growth without click growth usually means your titles and meta descriptions aren't matching what the searcher actually wants. Fix the pitch before you assume the page itself has a problem.
How to Use Benchmarks Responsibly
A benchmark is only as good as the peer group behind it. National blended averages hide the fact that a rural single-point Chevrolet store and an urban multi-franchise import group operate under completely different cost structures, according to Catalyst IQ's analysis of automotive marketing analytics. Build your comparison set around stores similar in volume, market type, and brand mix before you decide whether your numbers are actually good or bad.
- Prefer primary sources with stated methodology (NADA, Dealers United, Voltra) over vendor-reported "average results" with no defined sample.
- Grade CPL as good under $30, acceptable at $30 to $45, and a warning sign above $45; grade CPC as good at or under $1.20 and a warning sign above $1.75.
- Watch for last-click attribution overcrediting one channel, disconnected CRM and DMS data, and self-reported vendor numbers with no independent verification.
A 5-Step Checklist to Apply This Quarter
- Calculate your blended and channel-level cost per vehicle sold, and compare each against the benchmark bands above.
- Audit lead handling speed and conversion velocity. FourEyes' benchmark research found website form leads often convert faster and stronger than phone leads, with many sales closing within days, so a slow phone process can be quietly dragging down an otherwise good channel.
- Fix process problems (response time, follow-up cadence) before touching budget allocation.
- Reallocate spend toward fixed ops promotion or higher-converting inventory segments where absorption is lagging.
- Run a small holdout experiment, pausing spend in one comparable market or on one campaign, to measure incremental sales impact directly.
Pro Tip: *BCG's research found only about 30% of automotive marketers feel confident they can measure incremental impact.
Benchmark Comparison by Dealership Size and Type
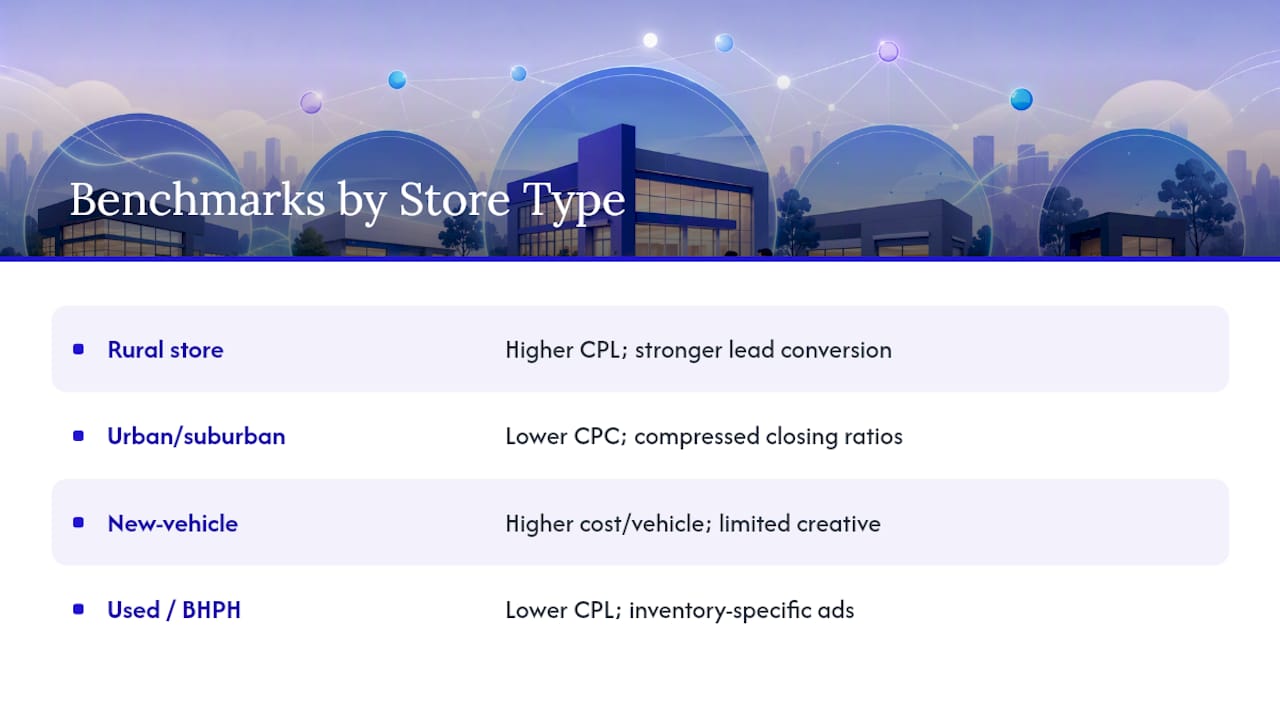
A single-point rural store and a five-rooftop urban group aren't playing the same game, even when their marketing budgets look similar as a percentage of revenue. Rural stores typically face higher cost per lead simply because there's less search volume and less competitive pressure keeping platform pricing efficient, but they often see stronger conversion once a lead is engaged, because there are fewer nearby alternatives pulling the buyer away.
Urban and suburban stores tend to see lower CPC on paid search due to higher volume and platform liquidity, but face steeper competition for the same in-market shoppers, which compresses closing ratios. New-vehicle-focused stores generally run higher advertising cost per vehicle sold than used-focused or independent stores, since new inventory carries thinner margins and manufacturer co-op requirements that constrain creative and messaging flexibility.
Used-vehicle and buy-here-pay-here operations typically see lower cost per lead on organic and local search but rely more heavily on inventory-specific ads (a listing for one specific VIN) rather than brand campaigns, which changes how cost-per-vehicle should be calculated. The practical takeaway: never compare your store's numbers against an industry-wide blended figure. Compare against stores that match your volume tier, franchise mix, and market density, or the benchmark tells you the wrong story.
Industry Average Benchmarks Over Recent Periods
Digital advertising costs for dealerships have trended upward over the past several benchmark cycles, driven by rising platform competition for the same in-market audience and by manufacturers pushing more co-op dollars into digital rather than traditional media. Cost per lead on paid search has drifted higher in most recent tracking periods, which is part of why the shift toward cost-per-vehicle measurement matters more now than it did five years ago: a rising CPL doesn't automatically mean worse marketing if conversion rates are holding steady or improving.
Comparing benchmarks period over period is more useful than reading a single quarter's number in isolation. Tracking trend lines rather than single snapshots protects marketing leaders from reacting to noise.
The consistent pattern across recent tracking periods is that fixed-ops and retention-focused spend has held steadier in cost-efficiency than acquisition spend, reinforcing the argument that budgets skewed too heavily toward conquest marketing are increasingly the wrong bet. Reviewing your own trend line quarter over quarter, not just against a single external benchmark, is the fastest way to catch a channel drifting the wrong direction before it does real damage.
CAC and LTV Benchmarks Specific to Dealerships
Customer acquisition cost in automotive retail looks deceptively low when measured only against the first transaction. A $400 to $600 cost per vehicle sold looks reasonable against a $1,800 front-end gross, but that comparison misses the real prize: lifetime value built from service visits, F&I products, and repeat or referral purchases over years of ownership.
Cross-industry retention data from Statista underscores why the acquisition-versus-retention math matters so much in a category with multi-year purchase cycles: retaining an existing customer costs a fraction of acquiring a new one, and dealerships that fail to track LTV alongside CAC end up systematically overfunding conquest campaigns relative to their actual return.
Calculating dealership LTV requires combining first-sale gross with average annual service revenue, F&I attach rate on repeat purchases, and estimated ownership tenure before a customer trades or moves away. A customer worth $3,500 in year-one gross who returns for four years of service and a second purchase can easily generate $7,000 to $9,000 in total value, which completely changes what you should be willing to pay to acquire them. Any CAC benchmark viewed without its corresponding LTV is only half the picture, and marketing teams that only report CAC to their general manager are, often unintentionally, making conquest spend look more efficient than it is.
Attribution Model Benchmarks and Multi-Touch Effectiveness
Last-click attribution still dominates dealership reporting, and it's also the single biggest distortion in most marketing scorecards. A customer who saw a display ad, clicked a Google search result two weeks later, and then called after seeing a retargeting ad will typically get credited entirely to whichever touch happened last, usually the phone call or the final click. That misattributes budget away from the channels doing the actual demand-generation work.
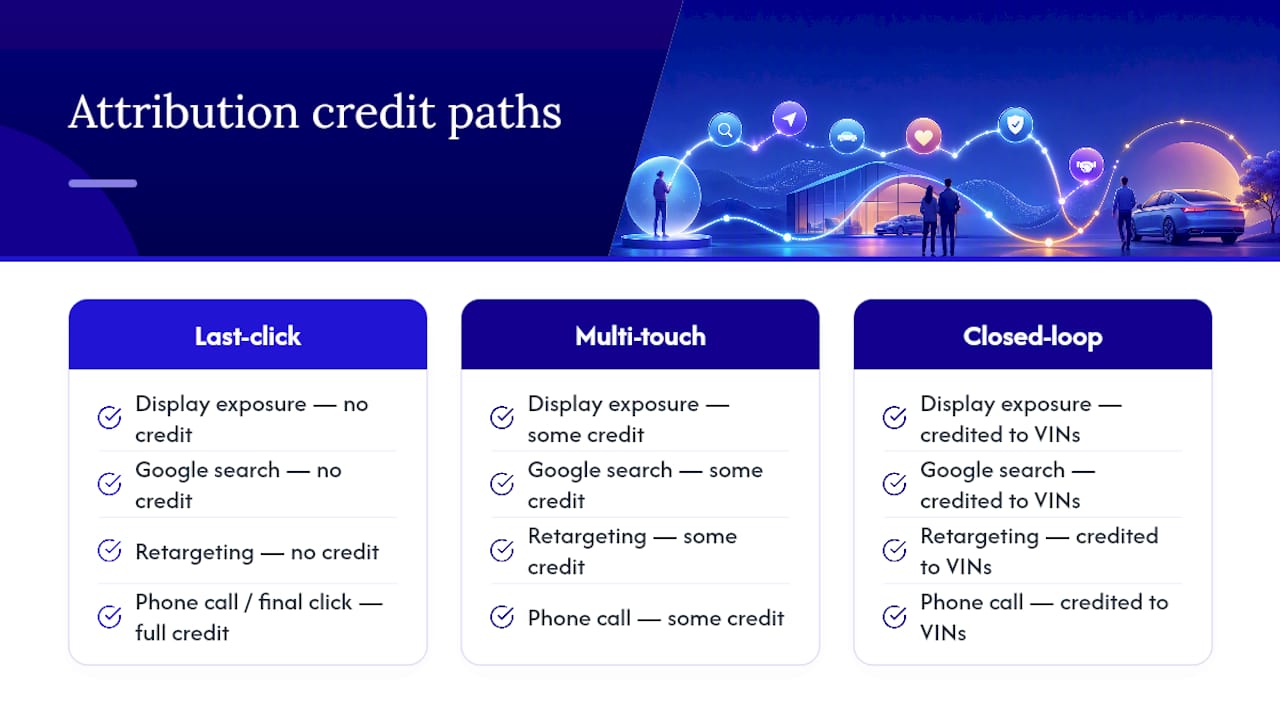
Keyloop's analysis of automotive retail ROI measurement makes the case plainly: connecting ad activity to sold VINs, not just to clicks or form fills, is what separates real performance management from activity reporting.
There's no single industry-standard multi-touch model that fits every store, but the direction is consistent: any dealership still reporting attribution purely on last click is almost certainly overfunding the channel that closes deals and underfunding the channels that create the demand in the first place. A closed-loop attribution approach that ties campaign data to sold VINs in your DMS is the practical fix, even if it takes a quarter or two to set up properly.
Social Media Engagement Benchmarks Beyond CPC and CPL
Follower growth and engagement rate matter less as vanity metrics and more as leading indicators of brand search volume six to eight weeks later.
Video content consistently outperforms static image posts on engagement rate across every major platform, which matters for automotive specifically because vehicle walkarounds and service-department content translate naturally to short-form video. A video advertising case study tracking dealership sales lift found that video-driven campaigns produced a measurable jump in attributed sales, reinforcing that engagement metrics aren't disconnected from revenue, they're just slower to show up.
Comment sentiment and response time are underused benchmarks worth tracking alongside raw engagement. A store responding to comments and messages within an hour during business hours tends to convert social engagement into showroom visits at a noticeably higher rate than one that lets messages sit for a day.
Traditional Marketing Channel Benchmarks: Radio, TV, and Direct Mail
Traditional media hasn't disappeared from dealership budgets, it's just been repositioned. Radio and local TV still work well for brand awareness and event promotion (a tent sale, a model launch) where the goal is reach within a specific drive-time radius rather than immediate click-through measurement. The tradeoff is attribution: without a dedicated tracking number or promo code, it's difficult to connect a radio spot directly to a sold VIN.
A dedicated call tracking setup is close to mandatory for radio and TV to be measurable at all. Assigning a unique tracked phone number to each traditional campaign lets you at least capture call volume and, with proper CRM logging, trace calls through to appointments and sales, closing part of the attribution gap that last-click digital reporting can't touch.
Direct mail has narrowed to a smaller but often more efficient use case: service reminders, lease-end conquest offers, and loyalty retention pieces targeted at customers already in your database. Response rates on direct mail to an owner base with a service or lease relationship typically run meaningfully higher than cold-list direct mail to non-customers, which is why the channel makes more sense as a retention tool than an acquisition one in most stores' budgets today.
AutoROIQ Perspective: What Benchmarks Mean Without a Vendor's Thumb on the Scale
Every vendor report a dealership receives is written by the vendor being graded. That's not a criticism, it's just structurally true, and it's why so many marketing directors can't say with confidence whether last quarter's spend actually worked. Vendor-agnostic analysis exists specifically to answer the question a self-reported number can't: which dollars produced incremental vehicles sold, and which just produced activity. An independent review typically surfaces the same finding: budget concentrated in the loudest-reporting channel, not the best-performing one. The value of a benchmark review isn't the benchmark itself. It's the prioritized list of what to fix first once you know where you actually stand.
— AutoROIQ
Get an Independent Read on Your Marketing Spend
An alternative to relying on vendor self-reporting for dealership marketing benchmarks is an independent review that tells you what's actually working, without a media buy to sell you afterward.

Every platform in this article, Google, Meta, TikTok, your local radio rep, has an incentive to grade its own performance favorably. Some independent services don't sell advertising in any channel, so a benchmark audit comes back with no stake in which line item wins. That's the core difference: a vendor-agnostic evaluation of your cost per vehicle, your channel mix, and your fixed-ops absorption against the peer-group bands covered above, delivered as prioritized recommendations rather than another dashboard to interpret yourself. Some advisory work centers on independent marketing ROI analysis built to identify exactly where spend is underperforming its benchmark band and what to redirect toward fixed ops or higher-converting inventory instead.
If your cost per vehicle hasn't been benchmarked against a real peer group in the last two quarters, request an audit through AutoROIQ to get a cost-per-vehicle analysis and a prioritized list of fixes for your next budget cycle.
Sources
- Car Dealers Marketing Benchmarks for 2026 | Dealers United
- Car Dealership Marketing Benchmarks 2026: Ad Cost & Stats | Get X Media
- Dealership KPI Dashboard: 15 Metrics + Free Calculator 2026 | Voltra
FAQ
What Are KPIs for Car Dealerships?
Dealership KPIs are the metrics that track sales, F&I, inventory, and service performance, including front-end gross per unit, closing ratio, inventory turn, days supply, and service absorption. Top-performing stores monitor lead indicators like cost-to-market weekly and lag indicators like gross per unit monthly.
What Are Benchmarks in Marketing?
A marketing benchmark is a reference range, drawn from a defined peer group and methodology, that tells you whether a metric like cost per lead or cost per vehicle sold is performing well, acceptably, or poorly. Benchmarks only work when compared against dealerships similar in volume, market type, and brand mix, not a broad national average.
How Much Does a Car Salesman Make on a Used Vehicle Car?
Commission structures vary widely by store and pay plan, but salespeople typically earn a percentage of front-end gross rather than a fixed dollar amount tied to vehicle price. On a lower-priced used vehicle, front-end gross and therefore commission tend to be modest compared to a higher-margin new or certified pre-owned sale.
What Are the Best Marketing Strategies for Car Dealerships?
The strategies that consistently perform best combine search advertising graded against CPC and CPL benchmarks, retention-focused direct mail and service marketing to existing owners, and closed-loop attribution that ties every channel back to sold VINs rather than clicks. Pairing acquisition spend with fixed-ops promotion tends to outperform conquest-only budgets on cost per vehicle over time.
How Do You Measure Dealership Marketing Success?
Measure success by cost per vehicle sold and service absorption rather than lead volume or click-through rate alone. A channel with a low cost per lead but poor conversion can still produce a high true cost per vehicle, which is why translating every channel's numbers into per-vehicle economics matters more than comparing raw CPL across platforms.