
Multi-touch attribution (MTA) assigns fractional credit to every marketing touchpoint across a customer's path to conversion, rather than giving all credit to a single interaction. Before you invest in building an MTA system, three questions determine whether it makes sense for your situation:
- Use MTA when: your campaigns run across multiple channels, your customers take more than one session to convert, and you have at least several hundred monthly conversions per conversion type to generate stable model outputs.
- Skip MTA for now when: conversion volume is low, your buyers typically convert in a single session, or you lack consistent event tracking and identity resolution across channels.
- Immediate next step: audit your event coverage and identity signals in GA4 or Adobe Analytics before selecting a model. Without clean data, even a sophisticated algorithm will produce misleading channel credit.
Salesforce, Nielsen, and the IAB each treat MTA as one component of a broader measurement stack, not a standalone answer. That framing matters as you read what follows.
Table of Contents
- How does multi-touch attribution actually assign credit?
- What are the common MTA model types, and which should you use?
- What data do you need before MTA results are trustworthy?
- How do you build an MTA system in practice?
- What pitfalls break MTA results, and how do you catch them?
- How does MTA compare to marketing mix modeling, and when do you use both?
- How do you validate whether MTA results reflect real incremental impact?
- Which tools and platforms support MTA, and what should you require from them?
- How should automotive dealerships apply MTA to their specific funnel?
- Key Takeaways
- The measurement gap most dealerships are not closing
- How Autoroiq helps dealerships measure and validate marketing performance
- Useful sources
How does multi-touch attribution actually assign credit?
The mechanics of MTA are straightforward in concept and demanding in execution. Credit flows through six sequential stages, and data quality problems at any stage corrupt everything downstream.
-
Event capture. Every ad impression, click, site visit, form submission, and conversion fires a tracking event. Each event should carry a consistent event name, a user identifier, a timestamp, campaign metadata (UTM parameters, ad IDs, placement), and the session source.
-
Identity resolution. Raw events arrive from multiple devices and sessions. The system stitches them into a single customer path using authenticated identifiers (email, CRM ID), device graphs, or probabilistic matching. Without this step, a customer who clicked a display ad on mobile and converted on desktop looks like two separate users.
-
Path construction. Resolved events are ordered chronologically to build a complete touchpoint sequence for each converting customer. The attribution window you set (7 days, 30 days, 90 days) determines which events qualify.
-
Model logic. The chosen model (rules-based or algorithmic) processes each path and calculates how much credit each touchpoint receives. Rules-based models apply fixed formulas; algorithmic models estimate counterfactual lift from historical path data.
-
Credit allocation. Fractional credit is assigned to each channel, campaign, and ad. These credits roll up into channel-level performance reports.
-
Reporting and action. Credit totals feed dashboards and budget decisions. This is where the measurement becomes useful or misleading, depending on how well the prior steps held up.
Three technical failure points appear repeatedly in practice. UTM inconsistency (inconsistent naming conventions across campaigns) breaks path construction by making the same channel appear as multiple sources. Duplicate conversion events inflate credit for the last touchpoint before the duplicate fires. Attribution window misalignment between your MTA system and your ad platforms creates apparent discrepancies that have nothing to do with actual performance.
Pro Tip: Set up a UTM governance document shared across every team that buys media. A single naming convention enforced at the campaign-creation stage eliminates the most common source of broken paths before any data reaches your attribution system.

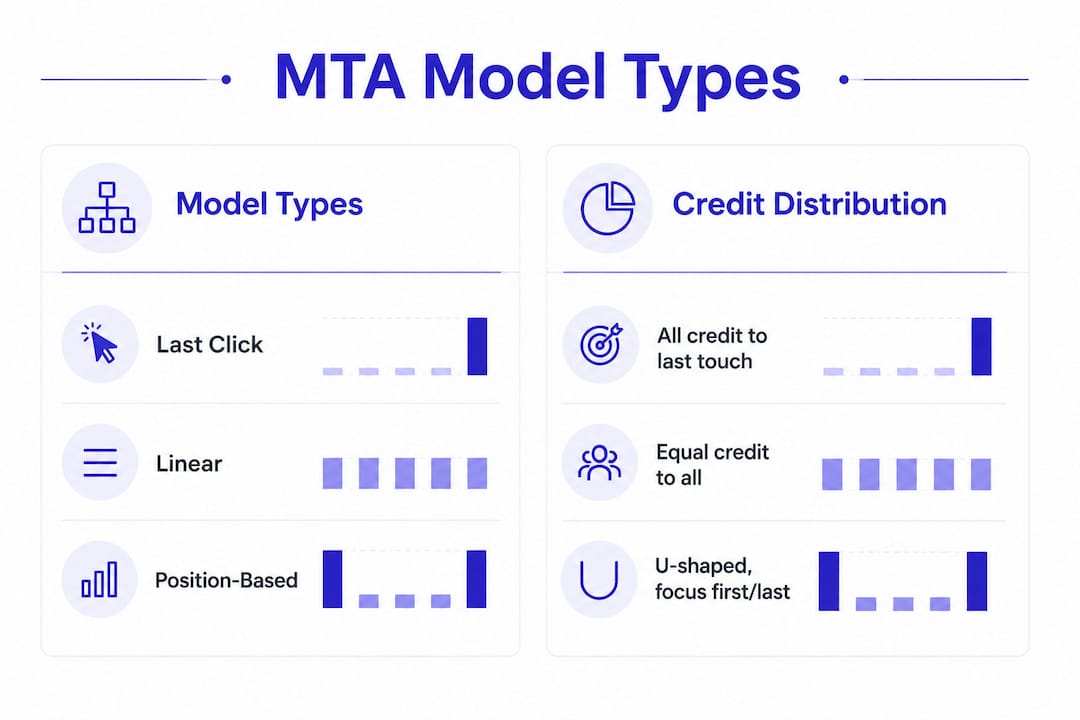
What are the common MTA model types, and which should you use?
Every attribution model is a theory about which touchpoints deserve credit. The model you choose shapes every budget decision that follows, so understanding the biases built into each one is not optional.
Rules-based models apply fixed formulas regardless of what the data shows:
- First click: 100% credit to the first touchpoint. Useful for measuring discovery channel performance, but it ignores everything that moved the customer toward conversion.
- Last click: 100% credit to the final touchpoint before conversion. Simple to implement and the default in most ad platforms. Systematically over-credits branded search and direct traffic while making awareness channels look worthless.
- Linear: Equal credit distributed across all touchpoints. Treats a display impression the same as a high-intent search click, which rarely reflects reality.
- Time decay: More credit to touchpoints closer to conversion. Logical for short sales cycles; penalizes awareness channels in longer funnels.
- Position-based (U-shaped): 40% to the first touch, 40% to the last touch, and 20% distributed across the middle. A reasonable compromise for teams that value both acquisition and close.
Algorithmic models use machine learning to estimate each touchpoint's actual contribution:
- Data-driven attribution (DDA): Google's DDA uses counterfactual analysis, comparing paths that converted against similar paths that did not, to estimate each touchpoint's incremental contribution. Google Ads' DDA trains on a rolling 90-day window and requires sufficient conversion volume to produce stable estimates. Accounts below roughly 300 conversions per month per conversion type may see fallback behavior toward rules-based logic.
- Bayesian approaches: Incorporate prior beliefs about channel performance and update them as new data arrives. More stable at lower volumes than pure frequentist DDA, but require more configuration.
The table below shows how credit shifts across models for a four-touchpoint path: Display → Paid Social → Organic Search → Branded Search (conversion).
| Touchpoint | Last Click | Linear | Position-Based (U-shaped) |
|---|---|---|---|
| Display | — | — | 20% |
| Branded Search | 100% | — | 60% |
GA4's model comparison report makes this shift visible in your own data. Paid social and display consistently appear undervalued under last click, while branded search and direct are overvalued. That pattern has real budget consequences if you are optimizing toward last-click numbers.
What data do you need before MTA results are trustworthy?
Reliable MTA outputs depend on a specific set of signals being present, consistent, and clean. Treat this as a minimum checklist before trusting any model output.
Required signals:
- Consistent event names across all channels and platforms (a "purchase" event should not also appear as "order_complete" or "transaction" in different systems)
- User identifiers that persist across sessions: authenticated email, CRM ID, or a hashed first-party ID
- Campaign metadata on every event: UTM source, medium, campaign, content, and term; plus platform-native ad IDs where available
- Timestamps accurate to the second, in a consistent timezone
- Clearly defined conversion events with no duplicate firing
- Server-side logs as a fallback when client-side tracking is blocked
Identity resolution options and tradeoffs:
Authenticated IDs (logged-in users, email matches) are the most accurate and privacy-safe. CRM graph matching links anonymous sessions to known customers using probabilistic matching against CRM records. Universal ID solutions (clean rooms, data collaborations) extend reach but add vendor dependency. Fingerprinting is a last resort: it degrades in accuracy over time and carries meaningful privacy and compliance risk under state-level privacy laws.
In cookieless environments, prioritize deterministic signals first and use probabilistic methods only as fallbacks. Server-side conversion APIs, such as Google Enhanced Conversions and Meta CAPI, capture materially more conversions than client-side pixels and form the backbone of reliable attribution without cookies. Industry data shows server-side methods achieving substantially higher match rates compared to pixel-only tracking.
Common hygiene failures to detect:
- UTM parameters missing on internal campaigns or email links
- Conversion events firing on page load rather than on confirmed action
- Cross-device paths broken because mobile sessions carry no identifier
- Conversion classification drift (a "lead" event redefined mid-quarter without updating historical data)
Capturing call tracking data into your event schema is especially important for dealerships, where phone leads represent a significant share of conversions that client-side tracking misses entirely.
How do you build an MTA system in practice?
Implementation follows four phases. The timeline and resourcing vary by organization size, but the sequence is consistent.
-
Phase 1: Discovery (2–4 weeks). Audit existing event coverage, identify identity resolution gaps, define conversion events, and document attribution windows. Deliverable: a data gap report and a prioritized fix list.
-
Phase 2: Data plumbing (4–8 weeks). Implement server-side event tracking, standardize UTM governance, connect CRM or DMS data to your analytics layer, and validate identity stitching. Deliverable: a clean, unified event stream.
-
Phase 3: Model selection and training (2–4 weeks). Choose a model appropriate to your conversion volume and funnel length. Configure attribution windows. If using DDA, confirm you meet volume thresholds. Deliverable: a running model with baseline channel credit outputs.
-
Phase 4: Reporting and operations (ongoing). Build dashboards, set monitoring alerts for sudden credit shifts, and establish a review cadence. Deliverable: a live reporting layer with documented governance.
Resourcing estimates by implementation size:
| Implementation | Engineering | Analytics | Timeline |
|---|---|---|---|
| Small (1–2 channels, GA4 native) | 1–2 weeks | 1 analyst | 6–8 weeks total |
| Medium (3–5 channels, third-party MTA) | 4–8 weeks | 1–2 analysts | 3–4 months |
| Large (omnichannel, custom model, DMS integration) | 2–4 weeks | 2–3 analysts + data engineer | 4–8 weeks |
For automotive dealerships, the event schema needs to map ad click through lead form submission, CRM lead status, and DMS sale record. Key fields: session_id, gclid or fbclid, lead_id, crm_status, sale_date, vehicle_vin, and channel_source. Connecting a dealership CRM to your attribution layer is the single highest-leverage data plumbing task in Phase 2.
What pitfalls break MTA results, and how do you catch them?
Most MTA failures are not model failures. They are data governance failures that the model faithfully amplifies.
Do:
- Assign clear ownership of UTM governance to one person or team
- Review channel credit distributions monthly for sudden shifts
- Document every change to conversion event definitions with a date stamp
- Run model comparison reports in GA4 quarterly to check for drift between DDA and last-click outputs
- Validate attribution windows against your actual sales cycle length
Don't:
- Change conversion event definitions mid-quarter without flagging the date in your reporting
- Trust a single model's output for large budget reallocations without incrementality validation
- Assume that more sophisticated models are always more accurate; a well-governed last-click setup often outperforms a poorly governed DDA setup
Three red-flag signals that indicate a broken or biased setup:
- A sudden reweighting of channel credit that coincides with a tagging change or platform update, not a real campaign change
- One channel's credit jumping more than 20 percentage points between reporting periods without a corresponding change in spend or strategy
- Conversion volume in your MTA tool diverging significantly from your CRM or DMS records
When you see model drift, the quick fix is to check for recent tagging changes, UTM inconsistencies, or conversion event redefinitions. The long-term fix is a governance protocol that requires sign-off before any change to tracking infrastructure.
Pro Tip: Set a monitoring alert in your analytics platform for any single channel's credit share moving more than 15 percentage points week over week. That threshold catches most tagging accidents before they drive a bad budget decision.
Reviewing the signs your dealership is wasting marketing dollars is a useful parallel exercise, because many of those signals trace back to attribution errors rather than actual channel underperformance.
How does MTA compare to marketing mix modeling, and when do you use both?
MTA and marketing mix modeling (MMM) answer different questions. Treating them as rivals misses the point. The IAB's measurement guide describes them as complementary: MMM provides aggregate, offline-aware budget guidance while MTA provides granular, digital-path-level tactics.
| Dimension | Multi-Touch Attribution | Marketing Mix Modeling |
|---|---|---|
| Unit of analysis | Individual user paths | Aggregate spend and outcome data |
| Data type | Event-level, digital | Aggregate, including offline and macro factors |
| Offline channels | Limited without DMS/CRM integration | Native; includes TV, radio, print, seasonality |
| Speed of insight | Near real-time | Weeks to months per model run |
| Minimum data scale | Hundreds of conversions/month | Months to years of aggregate spend data |
| Primary bias | Ignores unmeasured channels; correlation not causation | Averages over individual-level variation |
| Best for | Tactical channel optimization, creative testing | Strategic budget allocation, offline/online mix |
The practical workflow for combining them: run MMM quarterly or semi-annually to set channel-level budget guardrails and account for offline drivers (TV, events, economic conditions). Use MTA continuously to optimize within those guardrails at the campaign and creative level. When MMM and MTA disagree on a channel's value, treat that disagreement as a signal to run an incrementality test rather than defaulting to either model.
For a deeper look at how MMM fits into dealership budget planning, the media mix modeling guide covers the mechanics and cadence in more detail.
How do you validate whether MTA results reflect real incremental impact?
Attribution models measure correlation, not causation.) Observational MTA outputs can diverge substantially from what a randomized experiment would show. Validation is not optional if you are making significant budget decisions based on attribution data.
Running an incrementality test:
- Define the hypothesis: "Increasing spend on Channel X by Y% will produce Z additional conversions."
- Select a test design: geo-holdout (withhold the channel from a matched set of geographic markets), user holdout (randomly suppress the channel for a percentage of your audience), or time-based split.
- Set the measurement window to match your sales cycle. For automotive, a 30–60 day window is typical given the length of the purchase journey.
- Choose your primary KPI before the test starts: incremental leads, incremental sales, or cost per incremental conversion.
- Run the test without changing other variables. Any concurrent campaign changes contaminate the result.
- Measure the lift: (Test group conversion rate minus control group conversion rate) / control group conversion rate.
Statistical caveats:
- Small markets or low conversion volumes produce wide confidence intervals. A result that looks like a 20% lift may not be distinguishable from zero at standard significance levels.
- Spillover between test and control groups (a customer who sees an ad in a holdout market because they work in the test market) biases results toward zero.
- False positives are common when multiple tests run simultaneously. Adjust for multiple comparisons.
When attribution data and incrementality results agree, you can move budget with confidence. When they disagree, the incrementality result is closer to ground truth. Use the gap to recalibrate your attribution model's coefficients rather than discarding either source of information.
For ad creative testing within this framework, the same experimental discipline applies: define the hypothesis, isolate the variable, and measure against a held-out control.
Which tools and platforms support MTA, and what should you require from them?
MTA tooling falls into five categories, each with different capability profiles and tradeoffs.
Analytics suites (GA4, Adobe Analytics): GA4 provides data-driven attribution natively and includes a model comparison report that shows how credit shifts between DDA and last click. It is a strong baseline for digital-only paths. Its limitations: cross-device stitching depends on Google Signals and logged-in users; offline conversion integration requires manual uploads or API connections; raw path-level data export requires BigQuery. Adobe Analytics offers more flexible attribution windows and custom model configuration, but at significantly higher cost and implementation complexity.
Ad-platform native DDA: Google Ads and Meta both offer native DDA within their platforms. These models optimize for conversions within the platform's own ecosystem, which creates a systematic bias toward crediting that platform's own touchpoints. Use them for within-platform optimization, not for cross-channel budget allocation.
Third-party MTA platforms: Purpose-built for cross-channel path analysis, these platforms ingest data from multiple ad platforms, your CRM, and your site. They typically offer more flexible identity resolution and raw path export. The tradeoff is integration complexity and cost.
In-house model libraries: Teams with strong data science capacity can build custom models using Python libraries (scikit-learn, PyMC for Bayesian approaches) on top of a unified data warehouse. Maximum flexibility, maximum engineering investment.
Identity and graph providers: Clean room solutions and identity graph vendors extend cross-device and cross-publisher matching. Relevant for large advertisers with significant offline conversion volume.
Selection checklist for any MTA tool or platform:
- Server-side event ingestion (not pixel-only)
- Identity stitching with configurable match keys
- Raw path-level data export for independent validation
- Configurable attribution windows
- Privacy controls compliant with applicable state laws (CCPA, etc.)
- Model transparency: can you see how credit is calculated?
Where GA4 falls short for unified cross-channel MTA: it does not natively ingest offline conversion data at the path level, its identity graph is limited to Google-authenticated users, and its DDA model is a black box with no coefficient export. These gaps matter most for automotive dealerships, where a significant share of conversions happen offline and cross-device paths are the norm.
How should automotive dealerships apply MTA to their specific funnel?
The dealership purchase funnel has characteristics that make standard MTA setups unreliable without specific adjustments. The sales cycle runs weeks to months, conversions happen offline (in the showroom), and lead-to-sale lag means a conversion attributed in one month may reflect ad exposure from a prior month.
Dealership implementation checklist:
- Map the full funnel: ad click → VDP view → lead form submission → CRM lead status → DMS sale record
- Capture
gclid,fbclid, or equivalent platform click IDs on every lead form submission and pass them to your CRM - Record
lead_id,crm_status,sale_date,vehicle_vin, andchannel_sourcein your DMS for every closed deal - Define a cohort window (typically 60–90 days from first ad exposure) to capture delayed conversions accurately
- Integrate phone lead data via call tracking, capturing the originating session and campaign before the call
Example path mapping:
A customer clicks a Google Search ad for a specific vehicle model (capturing gclid), visits the VDP, submits a lead form (capturing lead_id and gclid), receives a follow-up call, visits the dealership, and purchases 18 days later. For attribution to credit the search campaign correctly, the gclid must survive from the click through the CRM record to the DMS sale record. Most dealerships lose this link at the CRM-to-DMS handoff.
For a holdout design at the dealership level: suppress a specific channel (e.g., paid social) in a matched set of zip codes for 30 days, measure lead volume and sales in test vs. control zip codes, and calculate incremental cost per sale. This approach is more reliable than path-level attribution alone for validating channel value in automotive.
Pro Tip: Use a 90-day cohort window when calculating channel credit for vehicle sales. Leads that close after 30 days are common in automotive, and a standard 30-day attribution window will systematically undercount the contribution of channels that drive early-funnel awareness.
Key Takeaways
Multi-touch attribution produces reliable channel credit only when event data is clean, identity resolution is deterministic, and outputs are validated against incrementality experiments before driving budget decisions.
| Point | Details |
|---|---|
| MTA requires sufficient volume | Algorithmic models need at least several hundred monthly conversions per conversion type to generate stable estimates; below that threshold, rules-based models are more reliable. |
| Data quality precedes model choice | Clean UTMs, server-side events, and identity stitching matter more than which model you select. |
| Validate with incrementality tests | Attribution measures correlation; geo-holdout or user-holdout experiments confirm real incremental impact. |
| Combine MTA with MMM | Use MMM quarterly for offline-aware budget guardrails; use MTA continuously for tactical channel optimization. |
| Autoroiq for dealerships | Autoroiq provides independent MTA audits, DMS/CRM mapping, and incrementality test design for automotive dealerships. |
The measurement gap most dealerships are not closing
The conventional wisdom in automotive marketing is that attribution is a vendor problem: each platform reports its own numbers, they never agree, and the dealer is left to pick a favorite. Most teams respond by defaulting to last-click or trusting whichever vendor's report looks best in a given month.
That approach has a real cost. Last-click attribution systematically undervalues the channels that create demand earlier in the funnel, which means dealers consistently underfund the campaigns that generate new shoppers and overfund the branded search campaigns that simply capture intent that already existed. The budget follows the credit, and the credit is wrong.
The more defensible position is to treat attribution as an internal measurement discipline, not a vendor deliverable. That means owning your event schema, running your own model comparison in GA4, and validating at least one channel's contribution with an incrementality test before making a significant budget shift. The tools to do this are available to any dealership with a competent analytics setup. What most teams lack is not access to the tools but a clear process for using them without being influenced by vendor-reported numbers.
The single most impactful first task for most marketing managers: pull your GA4 conversion path report, compare DDA credit against last-click credit for your top three channels, and identify which channel's share changes the most. That gap is where your current budget allocation is most likely wrong.
How Autoroiq helps dealerships measure and validate marketing performance
Dealership marketing teams face a specific version of the attribution problem: multiple vendors each claiming credit for the same sales, no clean link from ad click to DMS sale record, and no independent party to audit the numbers. Autoroiq's independent measurement service addresses exactly that gap.

Autoroiq provides dealerships with a structured data audit that maps your existing event coverage, identifies breaks in the ad-click-to-sale path, and delivers a prioritized fix list. From there, Autoroiq designs and interprets incrementality tests calibrated to your market and sales cycle, so you can validate which channels are actually driving incremental vehicle sales rather than just capturing credit. Every engagement is vendor-agnostic: Autoroiq does not sell advertising, which means the analysis reflects your actual performance, not a platform's preferred narrative.
To request a diagnostic, visit autoroiq.com. The diagnostic includes a data audit, a model comparison review, and a quick validation plan you can act on within 30 days.
Useful sources
- American Marketing Association: Multitouch Attribution in the Customer Purchase Journey — Academic and practitioner framing of MTA's role in measuring channel contribution across complex purchase journeys.
- Salesforce: Multi-Touch Attribution Best Practices — Practical explainer on MTA definitions, model types, and implementation considerations from a CRM-integrated perspective.
- IAB: The Essential Guide to Marketing Mix Modeling and Multi-Touch Attribution — Industry-standard reference covering MTA and MMM mechanics, data requirements, and how to combine both methods.
- Improvado: Cookieless Attribution Guide — Detailed breakdown of server-side attribution methods, identity resolution options, and match-rate benchmarks for cookieless environments.
- Wikipedia: Attribution (Marketing))) — Overview of attribution theory, the correlation-vs-causation distinction, and the role of incrementality testing in credible measurement programs.