
Use a layered cadence: daily checks for anomalies, weekly reviews for performance moves, monthly closes for financial reconciliation, and quarterly sessions for strategy and budget resets. Set the frequency for each metric at least twice per decision window, so there's always a midpoint checkpoint to course-correct. None of it works without named owners and published refresh SLAs behind each layer.
TL;DR:
- Daily reports should focus on anomaly detection and tracking issues that require immediate correction, such as broken tracking or misfiring campaigns.
- Weekly reviews should be limited to fast-moving operational metrics like spend and cost per lead, enabling quick adjustments during short standups.
- Monthly reports need to reconcile marketing performance with financial data, including bookings, ROMI, and CAC, with a 4–6 slide deck tailored for CFO-level discussions.
- Quarterly strategy reviews should cover campaign experiments, segment mix, and upcoming plans in an 8–12 slide presentation, supported by a detailed runbook and escalation plan.
- Assign clear ownership for each cadence, define refresh SLAs, and use a decision-window rule to ensure reports prompt timely action aligned with their decision speed.
Table of Contents
- What Is a Marketing Reporting Cadence, and Why Layer It?
- What Belongs in Each Report, and How Much Detail?
- Who Owns Each Cadence, and What Are the Rituals?
- How Do You Choose the Right Cadence for a Metric?
- What Templates Should You Build for Each Cadence?
- How Do You Keep Reports From Becoming Noise?
- How AutoROIQ Applies This to Dealership Reporting
- Why Discipline Beats More Dashboards
- Get Help Building a Cadence That Holds Up to Scrutiny
- Sources
- FAQ
What Is a Marketing Reporting Cadence, and Why Layer It?
A marketing reporting cadence is the schedule that determines how often you review and share performance data, and which decisions each review is meant to trigger. Most dealership marketing teams get this wrong in one of two ways: they report everything daily, which buries channel owners in noise, or they wait for the monthly deck, which means a stalled campaign burns budget for four weeks before anyone notices.
The fix is a four-tier structure where each layer matches decision speed to data latency, a framing the Pedowitz Group lays out clearly in its work on reporting cadence design. Daily views catch pipeline breaks. Weekly views drive budget shifts. Monthly views reconcile spend against what Finance actually booked. Quarterly views reset strategy and channel mix.
| Cadence | Primary purpose | Audience | Core metrics | Decisions enabled |
|---|---|---|---|---|
| Daily | Ops QA, anomaly detection | Ops lead, analysts | ETL status, tag health, anomaly flags | Fix broken tracking, pause a misfiring campaign |
| Weekly | Performance optimization | Channel owners | Spend, cost per lead (CPL), MQIs, SQLs | Shift budget between channels, adjust bids |
| Monthly | Financial close | RevOps, CMO, Finance | Bookings, ROMI, CAC, payback period | Approve reallocations, report to Finance |
| Quarterly | Strategy and allocation | ELT, dealer principal | Segment mix, experiment results, roadmap | Reset budgets, kill or scale programs |
Treat daily and weekly views as operational reads, provisional numbers meant for fast action, not final truth. Monthly is where you reconcile with Finance to produce booked actuals, a distinction Pedowitz's guidance makes explicit. Publish a fixed snapshot time for each tier (say, 6 a.m. daily, Monday 8 a.m. weekly, the third business day monthly) so nobody argues about whose numbers are stale.
What Belongs in Each Report, and How Much Detail?
The metrics you report should match how fast they move. Volatile, controllable inputs like spend pacing, click-through rate, and cost per lead belong in daily or weekly views because a channel owner can act on them immediately. Lagging financial metrics like bookings, return on marketing investment (ROMI), and payback period belong in monthly or quarterly reviews, since they require reconciliation against actual financial data before they mean anything.
Match the format to the tier:
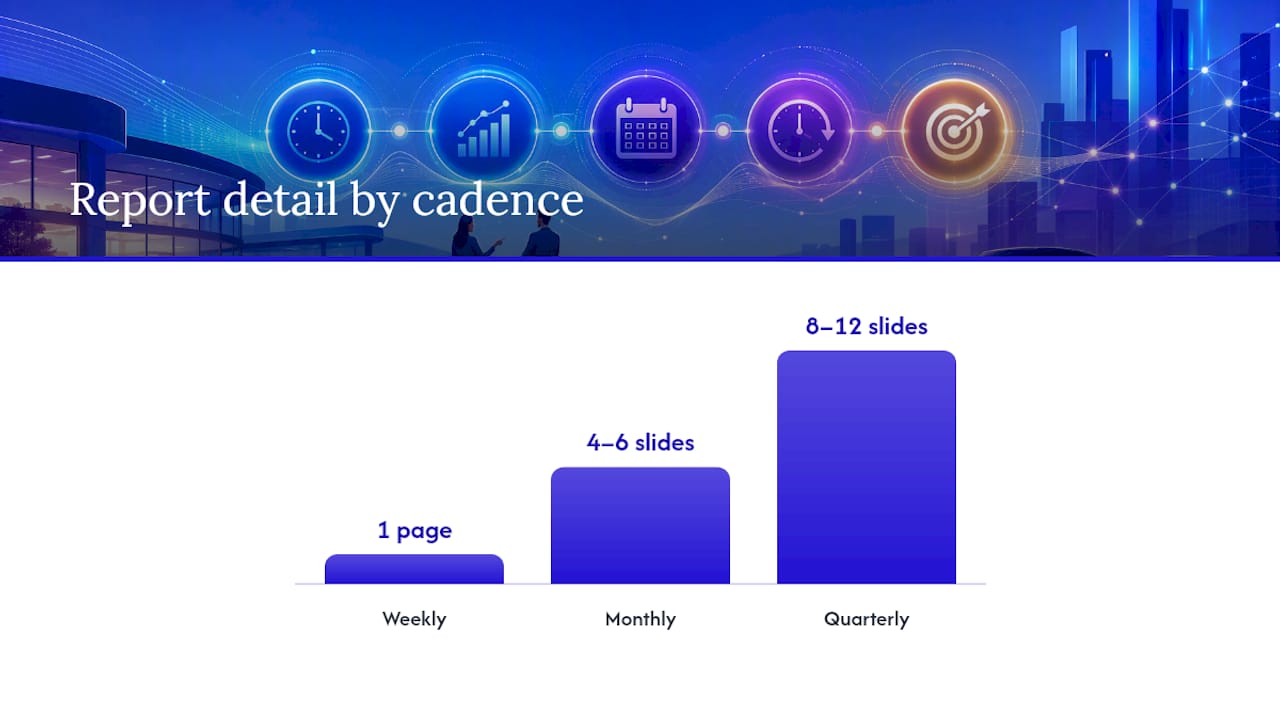
- Weekly: a single-page dashboard, reviewed in a 30-minute standup, following the structure Praxxii Global recommends for channel-level check-ins.
- Monthly: a 4–6 slide close deck built for a CFO conversation, not a data dump.
- Quarterly: an 8–12 slide strategy pack with an appendix for anyone who wants to dig deeper.
Every executive-facing page needs a short narrative, not just numbers. State what changed, why it changed, and what happens next; that three-part structure is what turns a chart into a decision instead of a homework assignment. An ops lead reading a daily anomaly flag needs raw detail. A dealer principal reading the quarterly pack needs three sentences and a recommendation, not a spreadsheet.
Who Owns Each Cadence, and What Are the Rituals?
Assign one owner per tier, or the cadence collapses the first time someone goes on vacation. The ops lead owns daily QA. Channel owners own weekly performance reviews. RevOps or the CMO owns the monthly close. The executive leadership team (ELT) owns quarterly strategy.
- Set refresh SLAs. Define exactly when data snapshots run and how stale a number can be before it's flagged as unreliable.
- Write a runbook. Document what counts as an anomaly, who gets notified, and how fast escalation happens.
- Standardize the calendar. Fix your fiscal weeks and months so a "weekly" number from marketing matches a "weekly" number from Finance, closing the gaps Pedowitz identifies as the source of most phantom variances.
- Run the ritual. A 15-minute daily standup, a 30-minute weekly review, a 60-minute monthly close, a half-day quarterly session.
Pro Tip: Put the runbook and escalation path in the same document as the dashboard link. If people have to search for who to call, the anomaly sits unresolved for a day longer than it should.
How Do You Choose the Right Cadence for a Metric?
Apply the decision-window rule: report at least twice within whatever window you can actually act on a number, a minimum standard Christopher Penn's analysis of reporting frequency lays out plainly. If your team reviews budget monthly, reporting weekly gives you a midpoint check to catch a problem before it costs a full month.
Run this checklist against any metric or campaign:
- Can the team act on this number, or just observe it?
- What's the decision window, and does the cadence hit it at least twice?
- Is the campaign launching (daily), stabilizing (weekly), or steady-state (monthly)?
- Does someone have the authority and bandwidth to act at that frequency?
If the answer to the capacity question is no, the cadence is wasted effort regardless of how good the dashboard looks.
What Templates Should You Build for Each Cadence?
Build in this order: weekly first, since it surfaces operational gaps fastest, then monthly, then quarterly, a sequence Praxxii Global recommends to avoid half-finished templates competing for attention.
- Weekly dashboard: spend pacing, CPL by channel, lead volume, and one annotation field for "what changed this week."
- Monthly close deck: 4–6 slides covering bookings, ROMI, CAC, payback, plus a reconciliation appendix tying marketing numbers to Finance's booked actuals.
- Quarterly strategy pack: 8–12 slides on segment mix, experiment results, and the coming quarter's roadmap, backed by an appendix.
- Runbook checklist: anomaly definitions, escalation contacts, and snapshot times for each tier, built alongside an executive dashboard that gives leadership one number they trust.
Teams building this from scratch often lean on a data product builder like Vetros to wire the alerting and dashboard layers together without custom engineering for every tile.
How Do You Keep Reports From Becoming Noise?
Segment every report by audience and decision. A channel standup and a CMO deck should never share the same slide. Standardize delivery times against your fiscal calendar so nobody's guessing which "month" a number covers.
- Track report engagement (open rate, time spent) and retire tiles nobody uses, a practice ReportsMate's research on reporting frequency ties directly to higher satisfaction.
- Run a quarterly retro specifically on the cadence itself, not just the metrics inside it.
How AutoROIQ Applies This to Dealership Reporting
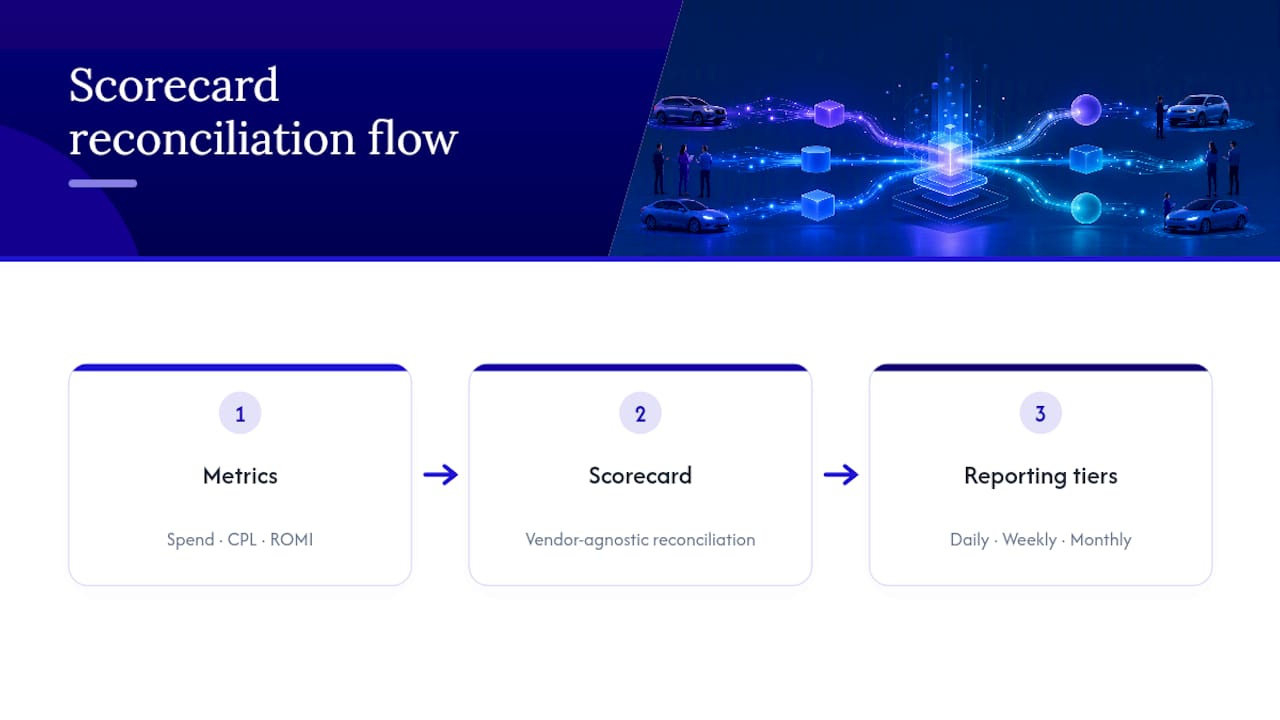
Vendor reports rarely agree on the same lead count, and that conflict is exactly what an independent read on agency performance is built to resolve. Vendor-agnostic scorecards can map spend, CPL, and ROMI to the same daily, weekly, and monthly tiers described above, helping reconciliation to avoid conflicting vendor claims.
Why Discipline Beats More Dashboards
Most dealerships don't need another dashboard. They need one cadence everyone trusts. Pick one program, apply the decision-window rule, instrument engagement on the reports you already send, and revisit the whole structure every quarter.
— AutoROIQ
Get Help Building a Cadence That Holds Up to Scrutiny
Setting the tiers is the easy part. Getting vendors, Finance, and channel owners to agree on the same numbers inside each tier is where most dealerships get stuck, especially when every ad vendor's monthly report tells a different story. AutoROIQ's Marketing Intelligence Review exists for exactly that gap: an independent, vendor-agnostic evaluation of your channels and vendor performance, with executive-level recommendations on where budget is actually working and where it isn't.

Because the recommendations from an independent marketing review aren't shaped by advertising sales interests, they provide an unbiased perspective on vendor performance. If your monthly close deck sparks more arguments than decisions, that's the signal to bring in an outside read. Reach out through AutoROIQ's FAQ page to see what a review would look like for your dealership's current vendor mix.
Sources
- What's the optimal reporting cadence for marketing?
- The 3 Marketing Reporting Templates Every CMO Should Run · Praxxii Global
- You Ask, I Answer: Marketing Reporting Frequency?
- Marketing Report Frequency Optimization: Finding the Sweet Spot | ReportsMate
FAQ
What Are Reporting Cadences in Marketing?
A reporting cadence is the fixed schedule for reviewing and sharing marketing performance data, layered by how fast a metric moves and how quickly a decision needs to happen. The standard model runs daily, weekly, monthly, and quarterly tiers, each tied to a different audience and decision type.
What Should a Marketing Report Include?
Every report should answer one clear decision question, backed by the right metrics for its cadence and a short narrative on what changed and why. Weekly reports lean on a one-page dashboard, while monthly and quarterly reports need 4–6 or 8–12 slides with a variance explanation for executives.
How Often Should You Report on Marketing Performance?
Report at least twice within your decision window so there's a midpoint checkpoint to adjust course, a minimum standard that scales with campaign stage. New launches often need daily checks for the first couple of weeks, tapering to weekly and then monthly as performance stabilizes.
What Are the Four Types of Marketing Reports?
The four core types map to the four cadence tiers: daily operational QA reports, weekly performance dashboards, monthly financial close decks, and quarterly strategy packs. Each type serves a distinct audience, from the ops lead checking daily anomaly flags to the executive leadership team reviewing quarterly budget allocation.
How Can AutoROIQ Help With Reporting Cadence?
AutoROIQ's Marketing Intelligence Review gives dealerships an independent, vendor-agnostic look at channel performance and vendor claims, which helps resolve conflicting numbers before they derail a monthly close. Pricing details for the review and AutoROIQ's ongoing advisory services are available on AutoROIQ's FAQ page.