
YouTube can produce measurable, defensible ROI, but only when you calculate it correctly and account for both format and measurement gaps. The two formulas you need are ROAS = Revenue ÷ Ad Spend, and ROI = (Revenue − Total Costs) ÷ Total Costs. Spend $10,000, generate $35,000 in attributed revenue, and your ROAS is 3.5x. Every number after that depends on whether you separate click-through, engaged-view, and view-through conversions instead of blending them into one misleading total.
TL;DR:
- Separating click-through, engaged-view, and view-through conversions is crucial to accurately measure YouTube ad performance and prevent misleading attribution.
- Creative quality accounts for nearly half of ROI, making early testing of hooks, brand exposure, and audience segments essential for campaign success.
- Using incremental or controlled tests helps identify true lift, especially when increasing spend or launching new campaigns, rather than relying solely on platform-reported data.
- Weekly creative and placement testing, combined with clear segment reporting, enhances steady ROI improvement over a disciplined four-to-eight-week cycle.
- Independent audits and measurement tools are recommended to validate ROI claims and avoid overreliance on platform dashboards that often conflate or overstate results.
Table of Contents
- How Do You Calculate YouTube Ads ROI?
- What Actually Drives YouTube Ads ROI?
- Which Measurement Method Should You Trust?
- How Do You Improve YouTube Ads ROI Over Time?
- What Belongs in a YouTube Ads ROI Report?
- What Marketers Consistently Get Wrong About YouTube ROI
- Get an Independent Read on Your YouTube Ad Spend
- Sources
How Do You Calculate YouTube Ads ROI?
Getting YouTube ROI right starts with distinguishing revenue from cost correctly, then applying the right conversion signal to each. Most advertisers get the math wrong not because the formula is hard, but because they mix conversion types that shouldn't be blended.
Here's the calculation sequence to run:
- Pull total ad spend for the period, including production and management costs, not just media spend.
- Identify total attributed revenue, split by conversion type (more on that below).
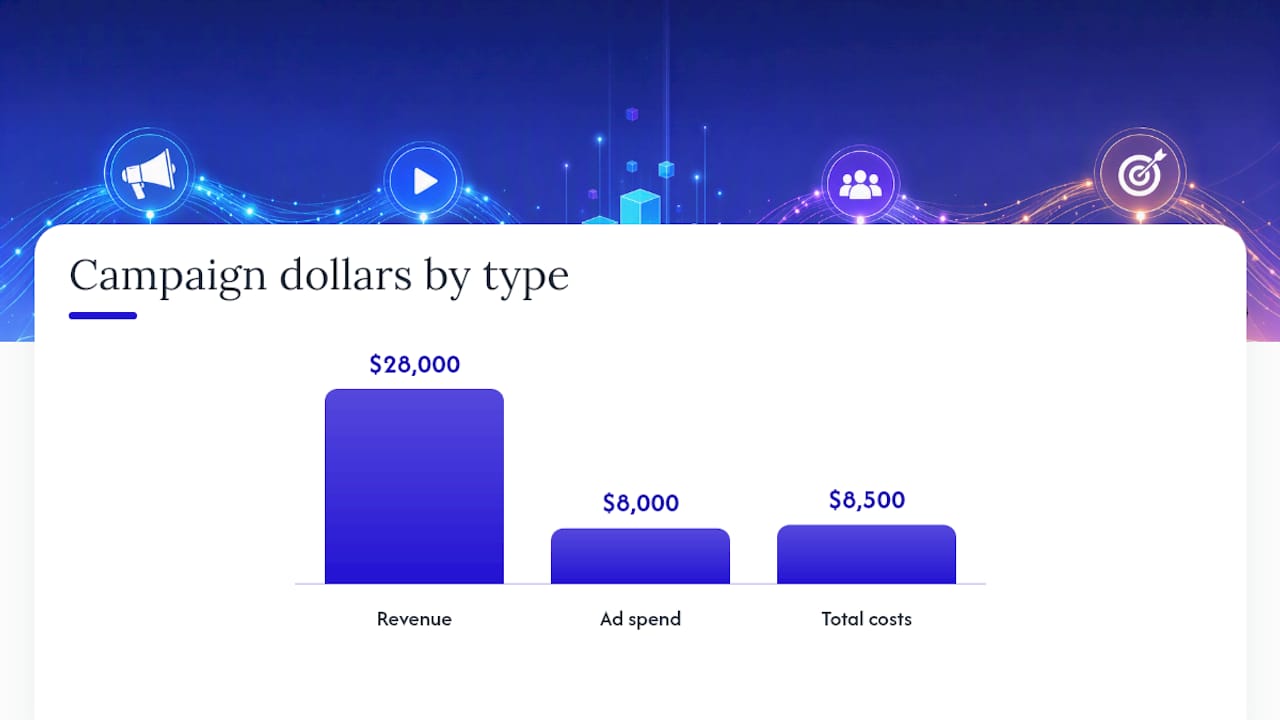
- Calculate ROAS: Revenue ÷ Spend. If you spent $8,000 and generated $28,000 in click-through and engaged-view revenue combined, that's 3.5x ROAS.
- Calculate ROI: (Revenue − Total Costs) ÷ Total Costs. Using the same numbers minus a $500 production cost, ROI comes to ($28,000 − $8,500) ÷ $8,500, or roughly 229%.
- Segment CPV and CPM separately: CPV (cost per view) applies when you're billed per engagement on skippable in-stream and in-feed formats; CPM (cost per thousand impressions) applies to formats like bumpers and some CTV placements billed on impression delivery.
The conversion split matters more than the formula itself. Click-through conversions happen when someone clicks the ad and later converts. Engaged-view conversions count when someone watches 10 seconds or more (or clicks) and converts within three days, even without a click. View-through conversions credit an ad view with no click at all, typically within a set attribution window. Prooflytics warns that blending these into a single ROAS figure misleads decision-makers, since attribution windows differ across channels and inflate perceived performance.
Pro Tip: Report ROAS three ways: click-through only, click-through plus engaged-view, and total including view-through. Show leadership all three, not one blended number.
What Actually Drives YouTube Ads ROI?
Creative quality drives roughly half of your campaign's ROI performance, more than targeting, format, or even budget size. Google's own research attributes about 49% of ROI to creative factors, meaning a mediocre ad on a great audience will usually underperform a great ad on a decent audience.
Four levers determine most of your outcome:
- Creative: The first five seconds decide whether viewers stay. Human voice, early brand exposure, and clear on-screen text correlate with improved conversion lift.
- Format mix: Skippable in-stream works for consideration and direct response; bumpers build frequency cheaply; Shorts reach mobile-first audiences at high volume; CTV delivers premium, living-room attention at higher CPMs.
- Reach and frequency: Full-funnel campaigns that mix awareness and action formats produce higher ROI than single-format campaigns, since awareness exposure feeds later conversion assists.
- Audience targeting: Custom intent and in-market layers narrow reach but often lift conversion rate enough to offset the smaller pool.
On benchmarks, expect CPV in the range of $0.02 to $0.10 depending on vertical and competition, with average view rates hovering around 30% for TrueView in-stream. CPMs vary widely by format, running low single digits for bumpers up to mid-teens for CTV and premium placements. If your CPV sits meaningfully above $0.10 with a view rate under 20%, your creative or targeting likely needs attention before you touch budget.
Shorts and other newer placements have grown fast enough that treating them separately in reporting matters. Blending Shorts metrics with long-form in-stream data hides which placement is actually earning its budget.
Which Measurement Method Should You Trust?
Every attribution method available for YouTube trades off simplicity against accuracy, and the honest answer is that no single method tells the whole story. Choosing the right mix depends on budget size, campaign maturity, and how much confidence your leadership needs before reallocating spend.
In-platform attribution is the fastest to read but the least defensible on its own. Google Ads reports click-through and view-through conversions natively, but the view-through attribution window (often set beyond 24 hours by default) tends to over-claim credit for ads that merely happened to run before an unrelated conversion. Engaged-view conversions offer a more defensible middle ground: crediting a view only when someone watches meaningfully or clicks, then converts within a tight window, filters out a lot of coincidental credit without discarding view-based impact entirely.
Brand Lift studies measure awareness and consideration shifts directly through surveys served against exposed and control groups. They require a meaningful budget commitment and enough impression volume to reach statistical confidence, so they make sense for larger campaigns testing new creative or entering new markets rather than every monthly flight.
The most rigorous options are marketing mix modeling (MMM) and geo or controlled incrementality testing. These methods hold out a control group, geographically or through randomized exposure, and measure the actual lift YouTube produces versus what would have happened anyway. This matters because platform-reported conversions routinely understate real impact. An analysis of 190 incrementality tests found YouTube drove 3.4 times more incremental sales lift than Google Ads reported in-platform on average.
Here's how to match method to situation:
- Small budgets, early testing: rely on engaged-view conversions and click-through data.
- Mid-size, consistent spend: add Brand Lift when launching new creative concepts.
- Material spend shifts toward video: budget for a geo or incrementality test before committing further.
Pro Tip: Run a geo-holdout test before you double a YouTube budget, not after. Finding out your reported ROAS was overstated after the increase costs you a quarter of wasted reallocation.
How Do You Improve YouTube Ads ROI Over Time?
Improving YouTube ads ROI comes down to a disciplined testing cadence, not one big creative swing. A structured four-to-eight week plan gets you from "we think this works" to "we can prove this works."
- Weeks 1 to 2, creative testing: Run two to three creative variants testing hook, voice, and branding timing. Google's 2026 creative guidance found human voice lifted conversions by a noticeable margin, text overlays contributed a smaller uplift, and early brand exposure also improved conversions in Demand Gen tests, small, cheap tests with real payoff.
- Weeks 3 to 4, placement splits: Segment Shorts, long-form in-stream, and CTV into separate campaigns or reporting views rather than one blended line.
- Weeks 5 to 6, audience layering: Test custom intent against in-market segments and a remarketing layer, holding creative constant.
- Weeks 7 to 8, budget scaling: Move spend toward winners only after each test group has enough conversions to be statistically meaningful, generally 30 or more per variant before drawing conclusions.
| Testing phase | What to optimize toward | What to report separately |
|---|---|---|
| Creative | Engaged-view conversions | Click-through vs. view-through revenue |
| Placement | View rate and CPV by placement | Shorts vs. CTV vs. in-stream ROAS |
| Audience | Conversion rate by segment | Assisted vs. last-click conversions |
| Budget scaling | iROAS from incrementality test | Blended vs. platform-reported ROAS |
Set a refresh cadence of four to six weeks for top-funnel creative before fatigue sets in, and stop underperforming tests early once a clear gap in CPV or conversion rate appears rather than waiting out the full budget.
What Belongs in a YouTube Ads ROI Report?
Daily and monthly reporting need different levels of detail, and mixing them wastes everyone's attention. Daily checks should catch problems fast; monthly reports should tell a defensible story to people who don't live in the account.
For daily monitoring, track:
- CPV by placement, flagged if it drifts more than 20% above your account average.
- First 5-second retention rate, since a sharp drop usually signals creative fatigue.
- View rate trend line, watched for a gradual decline rather than a single bad day.
For monthly executive reporting, include assisted conversions alongside last-click totals, iROAS from any incrementality test running that quarter, and Brand Lift results if a study was active. Present click-through, engaged-view, and view-through revenue as three separate lines, never one blended ROAS figure, and pair each with a one-sentence narrative: "Paid search closed the sale, but YouTube view-through exposure appeared in 40% of those customer paths."
What Marketers Consistently Get Wrong About YouTube ROI
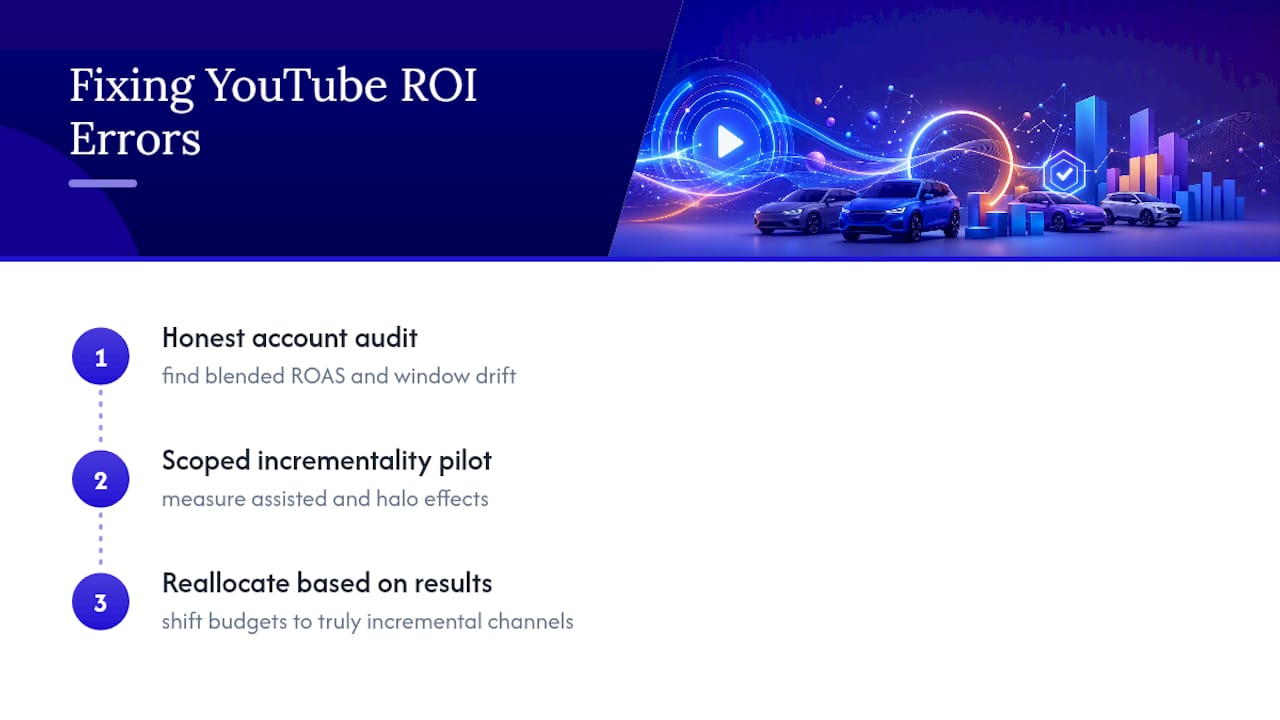
The most common mistake Autoroiq sees when reviewing dealership and performance marketing accounts is blended ROAS presented as a single, clean number. It flatters the channel in good months and hides real problems in bad ones. Attribution-window drift compounds the issue: a campaign that looks strong under a 30-day view-through window can look mediocre under a 7-day window, and few teams check which setting they're actually using.
The bigger blind spot is ignoring assisted and halo effects entirely. When Autoroiq runs independent measurement reviews, incrementality analysis frequently reshapes recommended budget splits, often shifting spend toward channels that platform dashboards had undervalued. The fix starts with an honest account audit, followed by a scoped incrementality pilot before any major reallocation.
— AutoROIQ
Get an Independent Read on Your YouTube Ad Spend
If you're tired of every vendor's dashboard telling a different story about the same budget, that's exactly the gap Autoroiq exists to close. Autoroiq doesn't sell media, so there's no incentive to inflate YouTube's reported numbers or defend a format because it's the one already funded.

Autoroiq's independent measurement work includes full account audits, vendor accountability scorecards, and incrementality testing designed to show what your YouTube spend is actually producing, not what a platform dashboard claims it's producing. Dealership marketing leaders get a clear, defensible view of where budget is working and where it's quietly leaking, the same discipline covered in Autoroiq's guide to measuring audio and video ad ROI for showroom traffic and sales. If your current agency's YouTube reporting doesn't separate click-through from view-through credit, that's worth a second look before your next budget cycle. Start with an account review through Autoroiq to see what an independent read on your numbers actually shows.
Sources
- Video advertising ROI drivers on YouTube Ads - Think with Google
- YouTube Ads Marketing Analytics: Metrics & Setup Guide | Prooflytics
- Do YouTube Ads Perform? Lessons From 190 Incrementality Tests