
Retention should get the first dollar, conquest gets the growth dollar. With overall brand retention holding at 43.9% in 2024 according to Reynolds & Reynolds, and truck retention running near 74.1%, most dealers are sitting on an underused retention pool before they ever need to prospect a stranger. J.D. Power's loyalty data backs this up: top brands post loyalty rates above 50%, which means half your buyers are already inclined to stay if you give them a reason.
- Conservative (protect P&L): 70% retention / 30% conquest
- Balanced (steady growth): 50% retention / 50% conquest
- Aggressive (market share push): 30% retention / 70% conquest
Pro Tip: Run your current retention rate against the Reynolds & Reynolds benchmark before setting next quarter's split. Conquest spend on a leaky base just burns cash faster.
An independent read on your numbers, the kind AutoROIQ provides, usually settles this argument in a single meeting.
Key Takeaways
Retention should anchor dealer marketing budgets because it costs less and performs more predictably, while conquest should scale spend once retention hits benchmark and growth becomes the priority.
| Point | Details |
|---|---|
| Retention has a ceiling | Overall brand retention sits at 43.9%, so conquest fills the gap once retention is optimized. |
| Segment differences matter | Truck retention near 74.1% changes the ideal mix compared to passenger vehicles. |
| Compare incrementally, not by raw CPA | Conquest CPA looks worse without adjusting for volume and close-rate differences. |
| Test before you scale | Holdout groups and a full sales cycle are required to prove real lift, not just attribution. |
| Get an independent read on your mix | AutoROIQ audits dealership CRM and transactional data to pinpoint the right conquest-retention split. |
Table of Contents
- Conquest vs Retention: What Each Term Actually Means
- Benchmarks That Show the Retention Ceiling and Conquest Opportunity
- Cost, Predictability, and ROI: Where the Numbers Diverge
- Retention and Conquest Tactics That Actually Move Metrics
- Proving Incrementality Instead of Just Attribution
- Choosing Your Budget Mix: A Repeatable Framework
- What to Confirm Before You Spend a Dollar
- The Errors We See Most Often in Dealer Budgets
- A Straightforward Take on Where the Budget Actually Belongs
- How AutoROIQ Helps You Get the Mix Right
- Primary Sources and Further Reading
- Sources
Conquest vs Retention: What Each Term Actually Means
Retention marketing keeps existing customers coming back for service and their next purchase. Conquest advertising automotive campaigns go after people who own a competitor's vehicle or haven't bought from you yet.
Retention tactics include service-lane offers, complimentary maintenance plans, CRM-triggered reminders, and reactivation sequences aimed at lapsed customers. Conquest tactics include competitor geo-fencing, behavioral retargeting against shoppers who visited rival inventory pages, and prospecting ads built on transactional or demographic data.
- Retention: service coupons, loyalty programs, CRM cadences, reactivation campaigns
- Conquest: competitor lot geo-fencing, behavioral retargeting, digital prospecting, geo-behavioral targeting
Reactivation sits in between the two. A lapsed customer isn't a stranger, but they're not currently loyal either. Treat reactivation as retention's first line of defense before that customer becomes someone else's conquest target.
Benchmarks That Show the Retention Ceiling and Conquest Opportunity
Retention has a ceiling, and the numbers show exactly where it sits. Reynolds & Reynolds found 24 of 38 tracked brands lost retention ground year over year, even as the national average ticked up slightly to 43.9%. Truck retention, at roughly 74.1%, dwarfs the passenger-vehicle average, which changes the math dramatically by segment.
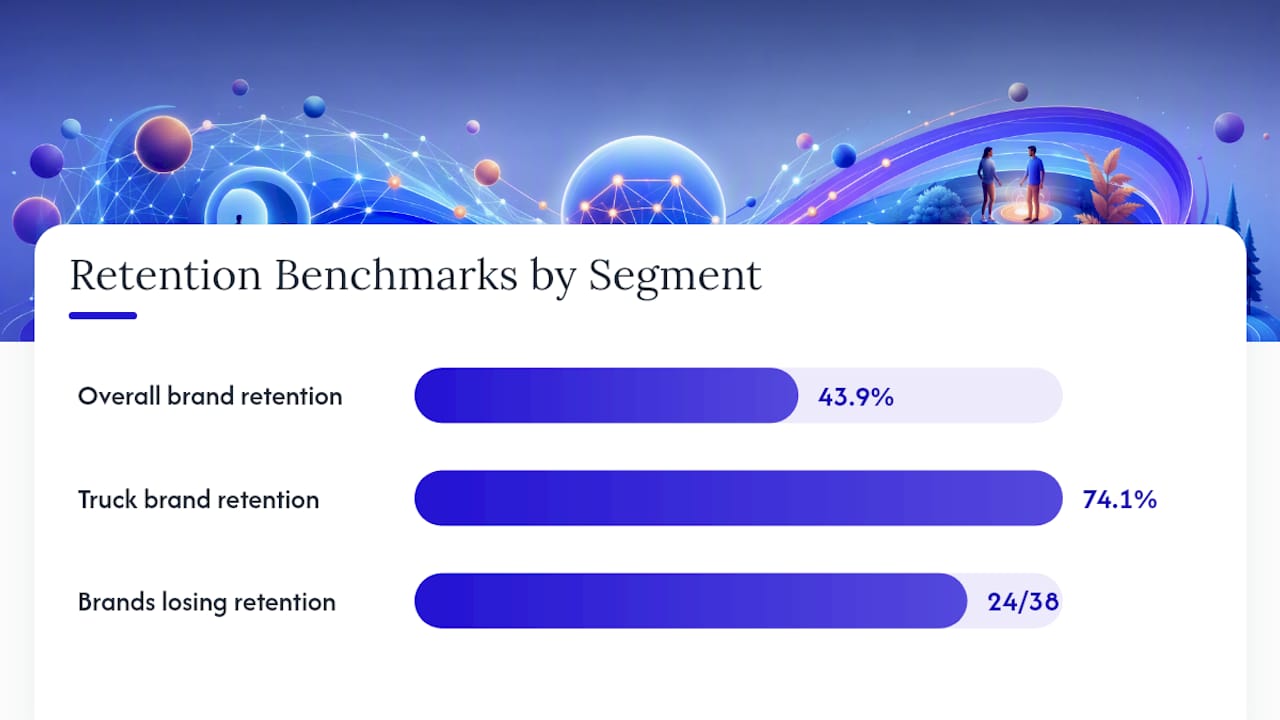
The practical calculation: multiply brand loyalty (J.D. That product is your realistic repurchase pool, not the whole registered-owner list in your CRM.
| Metric | 2024 Benchmark | Why It Matters |
|---|---|---|
| Overall brand retention | 43.9% | Sets the ceiling for retention-only growth |
| Truck brand retention | ~74.1% | Segment-specific opportunity varies widely |
| Top-brand loyalty (J.D. Power) | Above 50% | Determines your realistic repurchase pool |
- Track retention rate, defection rate, conquest rate, CLTV, and cost per lead side by side, never in isolation.
Cost, Predictability, and ROI: Where the Numbers Diverge
Retention wins on cost and predictability nearly every time. Ironmark's dealer guidance frames retention and reactivation as the more cost-effective, more predictable foundation of a dealer's P&L, while conquest carries higher acquisition costs and slower, less certain returns.

But predictability isn't the whole story. Conquest can still win on absolute unit growth because the addressable pool is larger. Conquest nets 100 units, retention nets 100 units. On paper they tie, but conquest scales further once you add budget; retention has a hard ceiling once you've contacted your entire loyal base.
| Dimension | Retention | Conquest |
|---|---|---|
| Cost-effectiveness | Lower CPA, cheaper per unit | Higher CPA, costlier per sale |
| Predictability | Stable, repeatable | Variable, market-dependent |
| Time to ROI | Fast, often within weeks | Slower, often a full sales cycle |
| Scale | Capped by existing customer base | Larger addressable audience |
| Measurement difficulty | Easier to isolate | Harder without holdouts |
- Never compare raw CPA between the two strategies. Conquest CPA will always look worse without a volume adjustment.
- Always normalize by incremental unit, not by lead count.
- Weight long-term CLTV alongside short-term CPA before declaring a winner.
That gap is often expected, not a red flag.*
Retention and Conquest Tactics That Actually Move Metrics
Service-lane offers and CRM cadences carry the lowest marginal cost of any tactic on this list, since you already own the customer relationship. Complimentary maintenance plans are a proven lever here: Performance Administration reports these plans can double or triple CP/RO counts in the first 12 months by forcing early service visits.
Conquest leans on different mechanics. Behavioral retargeting lets you follow up with anonymous shoppers who viewed competitor inventory, while inventory-based prospecting ads on platforms like Facebook scale efficiently against a broad audience. Competitor geo-fencing works well for one-to-one personalization but doesn't scale as cheaply as retargeting.
- Retention: service coupons, CRM-triggered emails, complimentary maintenance, reactivation sequences
- Conquest: geo-fencing competitor lots, behavioral retargeting, prospecting display and social ads
- Use a free service inspection as a low-friction conquest foothold. It gets a competitor's owner into your building without asking for a sale yet.
- Layer reactivation sequences ahead of conquest spend. It's cheaper to win back a lapsed customer than to win a stranger.
- Reserve one-to-one geo-fencing for high-value segments like truck buyers, where the payoff per unit justifies the cost.
Pro Tip: Service-lane data is a conquest asset too. Customers bringing in a competitor's vehicle for repair are warmer conquest leads than anyone you'd reach through cold prospecting.
Proving Incrementality Instead of Just Attribution
Attribution tells you what touched a sale. Incrementality tells you whether that sale would have happened anyway. Only the second question actually justifies a budget decision.
- Build a holdout group of comparable customers who receive no campaign exposure.
- Run the test long enough to cover a full sales cycle, typically 60 to 90 days for retention offers and longer for conquest.
- Compare conversion, service-bay visits, and CLTV between the test and holdout groups, not just click or impression counts.
| KPI | Proves Incrementality? | Notes |
|---|---|---|
| Sales lift vs. holdout | Yes | Gold standard, requires a clean control group |
| ROAS | Only with holdouts | Standalone ROAS conflates correlation with causation |
| Service-bay absorption | Yes | Strong retention signal, ties to CLTV |
| CLTV uplift | Yes | Best long-term validation metric |
Pull data from your DMS, CRM, and ad platforms into a single source of truth before running any test. Fragmented data is the number one reason holdout tests get thrown out by skeptical GMs.
Pro Tip: If your CRM data is messy, fix it before you test. A 90-day data hygiene cleanup is cheaper than a holdout test built on bad segmentation.
Choosing Your Budget Mix: A Repeatable Framework
Start by mapping three inputs: your current retention rate against the Reynolds & Reynolds benchmark, your service-bay utilization, and your stated growth goal for the year.
- If retention sits below 43.9% and service bays have open capacity, prioritize retention. Fix the leak before you fund growth.
- If retention is at or above benchmark and inventory needs to move faster than the loyal base can absorb, shift toward conquest.
- If you're launching a new model line or entering a new market, an aggressive conquest tilt, similar to the 80/20 conquest-to-retention split some practitioner guides recommend, can make sense for a defined window.
- Conservative mix (70/30 retention/conquest): best when protecting margin and service revenue is the priority.
- Balanced mix (50/50): best for steady, sustainable share growth without straining either channel.
- Aggressive mix (30/70 retention/conquest): best for a short, defined growth push, not a permanent default.
Pro Tip: Revisit the mix every quarter, not once a year. Inventory cycles and competitor promotions shift the math faster than most annual budget reviews account for.
What to Confirm Before You Spend a Dollar
Clear this short list before launching either strategy:
- Tracking and pixel setup confirmed across CRM, DMS, and ad platforms
- CRM hygiene reviewed and duplicate or dead records removed
- Audience deduplication in place so conquest and retention lists don't overlap
- Creative assets ready for both segments, not a single generic message
- Service offers loaded and staffed for an expected lift in visits
- Holdout group defined before launch, not added retroactively
- Ask any vendor how often they report incrementality data, not just impressions or clicks.
- Ask who owns the raw data if you end the engagement.
- Ask how audience overlap between retention and conquest lists gets resolved.
The Errors We See Most Often in Dealer Budgets
AutoROIQ evaluates dealer marketing mix using dealership-level transactional and CRM data, not vendor-supplied summaries, which is why our recommendations often contradict the agency reporting a dealer already trusts.
The most common error isn't picking the wrong split. It's picking a split once and never revisiting it as retention rates, inventory, and competitor activity shift underneath it.
- Static budget splits that never adjust for seasonal inventory or a competitor's aggressive promotion
- No holdout testing, so conquest campaigns get credit for sales that would have closed anyway
- CRM hygiene neglected, which quietly inflates both conquest waste and retention underperformance
An evidence-based audit usually surfaces at least one of these within the first review cycle.
A Straightforward Take on Where the Budget Actually Belongs
The dealers who get this right treat the split as a live decision, not a policy set once and forgotten. Retention protects the P&L you already have. Conquest is the growth lever you pull once that base is stable. Measure both with the same rigor, and let the incrementality data, not habit or vendor pressure, decide the next quarter's mix.
How AutoROIQ Helps You Get the Mix Right
Autoroiq is the independent check most dealers skip before locking in next quarter's budget. Rather than selling advertising or defending a media mix, Autoroiq analyzes your actual CRM, DMS, and ad performance data to show exactly where your conquest and retention dollars are working and where they're wasted.

A typical engagement delivers a prioritized fix list, a clear read on your current retention rate against industry benchmarks, and sample ROI scenarios for shifting your mix. No vendor bias, no ad sales pitch attached to the findings. If you want a defensible, data-backed answer for your next budget meeting, start with AutoROIQ's marketing intelligence review and see where your current split actually stands.
Primary Sources and Further Reading
- Reynolds & Reynolds 2025 Retention and Defection Report: core retention and truck-segment benchmarks
- J.D. Power 2025 U.S. Automotive Brand Loyalty Study: brand loyalty rates for CLTV math
- Ironmark: Conquesting, Retention and Reactivation: cost-effectiveness framework
- BoulevardDM: Conquest vs. Retention Budget Guide: sample aggressive-growth allocation
- AutoROIQ Insights: ongoing dealer-specific benchmark analysis
Sources
- 2025 Automotive Brand Retention and Defection Report: Understanding Your Opportunities for Conquest
- Report: Brand retention rises but shows signs of loyalty erosion
- 2025 U.S. Automotive Brand Loyalty Study (press release)
- Dealerships: Conquesting, Retention and Reactivation
- Conquest vs. Retention – Where to spend Auto Dealer Ad Budget