Publicly traded franchise dealers control roughly 7% to 8% of annual new light-vehicle sales, while the largest 150 dealer groups combine for about a quarter of new-car volume, according to Morningstar. Used vehicles now outsell new ones at the dealer level, making up the dominant retail channel and the industry's steadiest profit engine. The strategic takeaway: capital, not geography, is becoming the deciding factor in who gains share, and electrification is accelerating that split.
TL;DR:
- Capital investment and used-vehicle dominance are critical in gaining market share as the industry shifts toward electrification and longer trade cycles.
- Used vehicles now represent over 52% of dealer sales volume, driven by consumer preference, longer financing terms, and strategic inventory building.
- Public dealer ownership holds only about 7-8% of new-car sales, with most volume still managed by smaller independents and gradual consolidation among large dealer groups.
- Winning share depends on operational efficiency, especially fast reconditioning (27 days), strong digital retailing, and leveraging used-vehicle margins for profitability.
- Strategic focus areas for dealers include data-driven marketing, redefining service and parts revenue as a competitive advantage, and preparing for legal, regulatory, and regional market shifts through automation and diversification.
Table of Contents
- Dealer Market Share by the Numbers: Units, Revenue, and Channel Splits
- How Dealer Market Share Breaks Down Across the Industry
- What's Actually Shifting Dealer Market Share Right Now
- Where Dealer Market Share Is Headed Through 2031
- The KPIs and Moves That Actually Protect Dealer Share
- AutoROIQ's Approach to Defensible Dealer Data
- Regulation's Growing Influence on Dealer Market Share
- Regional and Vehicle-Segment Differences in Dealer Share
- How Dealers Are Fighting to Defend Their Share
- Digital Transformation's Role in Redrawing Dealer Share
- Where I'd Put the Next Dollar of Effort
- Get an Independent Read on Your Market Position
- Primary Sources Behind This Data
- Sources
Dealer Market Share by the Numbers: Units, Revenue, and Channel Splits
Franchised light-vehicle dealers sold approximately 16.2 million light-duty vehicles in 2025, generating total dealer sales above $1.3 trillion, according to NADA Data. Service and parts revenue crossed $164 billion for the year, a figure that matters more than it might first appear. Front-end new-vehicle gross has been under pressure for several quarters, and service and parts has become the buffer that keeps blended profitability intact even when unit sales stall.
The channel split tells its own story. Used vehicles accounted for about 52.85% of dealer volume in 2025, according to ResearchAndMarkets, edging past new-vehicle sales as the larger share of dealer throughput. That's not a temporary blip caused by supply shortages. It reflects a structural shift toward certified pre-owned programs, longer loan terms that keep trade cycles slower, and dealers actively building used inventory as a hedge against new-vehicle allocation swings.
Franchised dealer groups controlled about 57.60% of the overall dealership market in 2025, per the same ResearchAndMarkets analysis, with independent used-only lots and digital-first sellers splitting the remainder. That franchised dominance isn't shrinking quickly, but the composition within it is changing as public groups absorb rooftops from retiring owners.
Here's how the core figures line up for planning purposes:
| Metric | Figure | Source |
|---|---|---|
| New light-vehicle units sold (2025) | ~16.2 million | NADA Data |
| Total franchised dealer sales (2025) | >$1.3 trillion | NADA Data |
| Service and parts revenue (2025) | >$164 billion | NADA Data |
| Used-vehicle channel share (2025) | a majority share | ResearchAndMarkets |
| Franchised dealer market share (2025) | a majority share | ResearchAndMarkets |
| Top-performer reconditioning target | ~27 days | Morningstar |
Operationally, the gap between average and top-quartile dealers shows up most clearly in reconditioning speed. High performers push turn times down to roughly 27 days, while the broader industry median sits closer to 35 days, per Morningstar's dealer landscape research. Eight days doesn't sound dramatic until you translate it into floorplan interest, lost merchandising windows, and the number of extra turns a rooftop can generate in a calendar year.
A few operational realities follow directly from these numbers:
- Service and parts revenue is now a market-share defense mechanism, not just a margin add-on.
- Used-vehicle throughput speed determines cash velocity more than new-vehicle allocation does for most rooftops.
- The reconditioning gap between median and top-quartile dealers compounds every month it goes unaddressed.
How Dealer Market Share Breaks Down Across the Industry
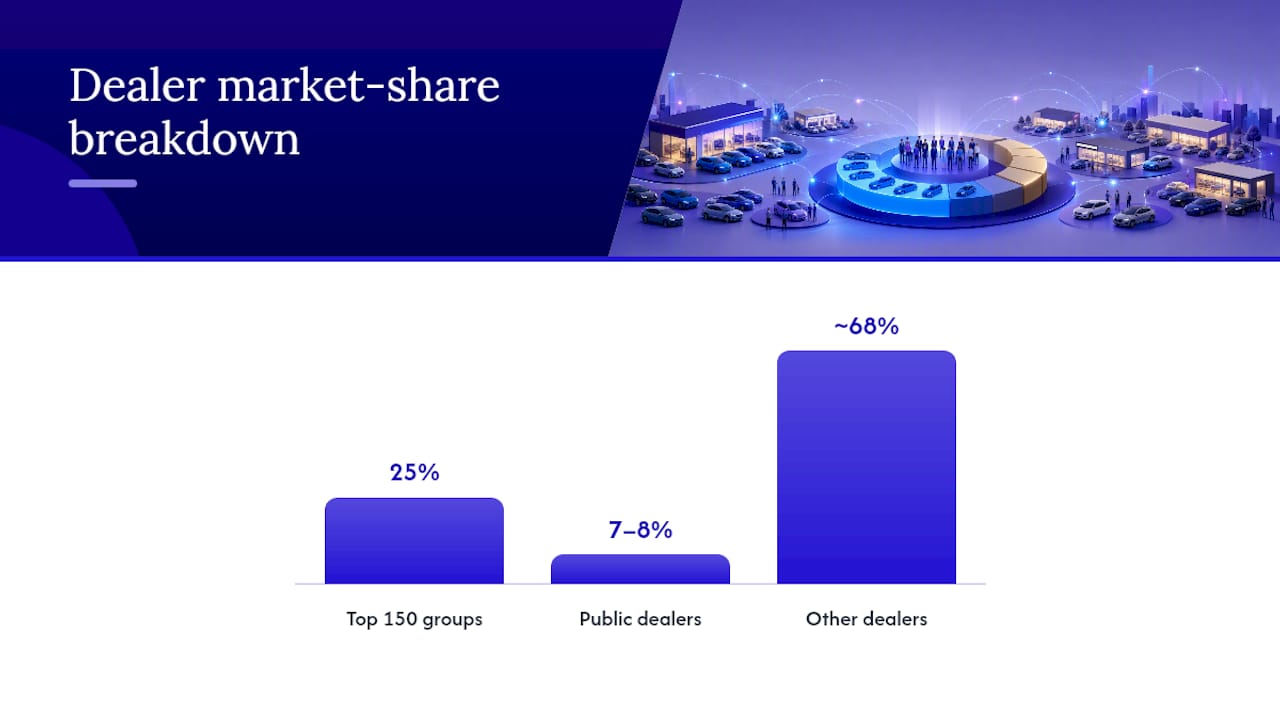
Public ownership gets outsized media attention, but it still represents a minority of total volume. Publicly traded new-vehicle franchise dealers hold approximately 7% to 8% of annual new light-vehicle sales, while the top 150 dealer groups, public and private combined, account for roughly 25% of the new-car market, according to Morningstar. The remaining volume flows through thousands of independently owned rooftops, and more than half of all dealerships in the country retail fewer than 500 new vehicles annually. Consolidation is real, but it's gradual, not a wholesale market takeover.
Rooftop count still favors small operators even as transaction volume tilts toward scale. That distinction matters for anyone building a competitive set: counting dealerships tells you little about who actually moves the market's units.
The named players worth tracking, and what each represents:
- Lithia Motors operates one of the largest multi-brand footprints in the country and has grown aggressively through acquisition across both new and used channels.
- AutoNation runs one of the largest publicly traded dealer networks, with a strong emphasis on used-vehicle standalone stores and captive finance.
- Penske Automotive Group combines domestic dealership operations with a global commercial truck and premium-brand distribution business, diversifying its revenue base beyond retail.
- CarMax built its scale almost entirely on used vehicles, pairing physical stores with a heavily digital buying and selling experience.
- Asbury Automotive Group has expanded through acquisition into a national multi-brand platform while investing in digital retailing tools.
- Sonic Automotive operates both traditional franchise stores and EchoPark, its standalone used-vehicle brand aimed at value-focused buyers.
- Group 1 Automotive runs dealerships across the U.S. and the U.K., giving it a geographic diversification most domestic-only groups lack.
For OEMs managing allocation and for private groups weighing an exit, this concentration curve matters. Public groups' lower cost of capital lets them win open points and absorb aging owner-operator stores faster than smaller independents can compete for the same real estate, per Morningstar's dealer analysis.
What's Actually Shifting Dealer Market Share Right Now
Three forces are reshaping who wins share, and none of them move at the same speed.
- Electrification is raising the capital floor. OEM-mandated EV store-imaging, charging infrastructure, and specialized service-bay tooling require upfront investment that smaller independents often can't absorb without financing help. Groups with lower borrowing costs can fund these mandates and pick up open points that undercapitalized owners walk away from.
- Digital retailing is compressing price opacity. Online configurators, transparent pricing tools, and direct-to-consumer platforms have made it harder for any single dealer to hold a local information advantage. Volume increasingly flows toward whichever operator, large or small, delivers the smoothest omnichannel purchase path rather than the closest lot.
- Used-vehicle economics are propping up margins dealers can't get from new cars. Certified pre-owned premiums, stronger residual values, and faster turn rates mean used inventory now carries real profit weight. Combined with growth in F&I attachment and service-lane revenue, this offsets the well-documented compression in front-end new-vehicle gross, a pattern Mordor Intelligence's market analysis also flags as a durable trend rather than a temporary correction.
None of these forces work in isolation. A dealer that's slow on digital retailing but fast on reconditioning can still hold share against a digitally polished competitor with a bloated used lot. The forces interact, and the groups managing all three simultaneously are the ones pulling ahead of the pack.
Where Dealer Market Share Is Headed Through 2031
Mordor Intelligence projects the U.S. automotive dealership market growing from $2.95 trillion in 2025 to $3.08 trillion in 2026, reaching approximately $3.83 trillion by 2031, a compound annual growth rate near 4.47% across that stretch. That's a steady, unspectacular baseline, and it assumes production levels normalize and consolidation continues at its current gradual pace.
Three scenarios are worth stress-testing against your own planning assumptions:
- Baseline scenario: Vehicle production stabilizes, incentive levels stay moderate, and consolidation proceeds at the same measured rate seen over the past several years. Growth tracks close to the Mordor Intelligence CAGR with no major share disruption.
- Accelerated consolidation scenario: Capital continues flowing preferentially to well-capitalized multi-state groups, which use lower borrowing costs to acquire aging independent rooftops faster than the baseline assumes. Top-150 share could climb meaningfully above the current 25% mark within this window.
- Digital disruption scenario: Asset-light, direct-to-consumer platforms gain unit share faster than expected, per ResearchAndMarkets forecasts showing higher projected CAGR for digital-first channels, but at materially lower contribution margins than traditional franchise operations.
The variables that would tip the balance between these paths include OEM incentive spending, the pace of new EV allocation to independent versus public groups, interest-rate movement affecting floorplan costs, and any regulatory pilots around direct sales models. Executives modeling budgets past 2027 should treat the baseline CAGR as a floor, not a ceiling, and build a separate stress case around faster-than-expected consolidation.
The KPIs and Moves That Actually Protect Dealer Share
Market-share data is only useful if it changes what gets measured on the showroom floor. Six metrics deserve a permanent spot on the executive dashboard: turn days, inventory age, front-end gross per unit, service revenue per repair order, F&I revenue per unit, and CPO penetration rate. Together they capture both the front-end and the back-end levers that determine whether a rooftop is gaining or losing ground.
Four actions produce the fastest return on that visibility:
- Push reconditioning toward the 27-day benchmark. Every day saved between acquisition and front-line-ready status reduces floorplan interest and increases the number of annual turns per unit, a lever Morningstar's operational research identifies as one of the highest-leverage changes a dealer can make without added capital.
- Build out CPO and certified lanes deliberately, rather than treating certification as an afterthought on aging inventory. CPO penetration correlates directly with both margin and turn speed.
- Tighten acquisition sourcing to cut reliance on auction fees and improve the quality of trade-in and wholesale purchasing pipelines.
- Pilot an omnichannel checkout path if one isn't live yet, even a limited version, since price transparency is no longer optional for buyers comparing multiple rooftops before they visit one.
None of this works without defensible vendor data. Before reallocating a marketing budget based on any single vendor's self-reported performance, request the raw attribution fields behind their numbers: source-level lead counts, cost per lead by channel, VDP view data, and closing ratios tied to actual sold units, not just form submissions.
That gap is usually where budget is being wasted.*
A dealership marketing audit checklist can structure that review, and pairing it with tighter agency performance metrics tracking closes the loop between vendor claims and dealership reality.
AutoROIQ's Approach to Defensible Dealer Data
AutoROIQ evaluates vendor performance and marketing channels through a vendor-agnostic methodology built specifically because dealership leaders rarely get a straight answer from the vendors selling them services. AutoROIQ doesn't sell advertising, which means the scorecards clients receive aren't shaped by an incentive to protect any particular channel or platform.
Engagements translate directly into a prioritized operational roadmap: which vendors are underperforming their own claims, where budget should shift, and what to measure going forward. Executives get more than an insights and analyses read, they get a defensible basis for reallocating spend with confidence rather than guessing which vendor's dashboard to trust.
Regulation's Growing Influence on Dealer Market Share
Franchise laws remain the single biggest structural protection independent and mid-size dealers have against direct-to-consumer disruption. State franchise statutes generally require new-vehicle sales to flow through licensed dealers, which is why OEM attempts at direct sales models have advanced unevenly state by state rather than nationally. Any shift in that legal framework, even at the margins, would move share faster than most operational changes could.
Emissions and fuel-economy standards also shape which inventory dealers can profitably stock, indirectly steering which groups gain ground. Dealers in states with aggressive EV mandates face earlier pressure to build charging infrastructure and specialized service capacity, favoring groups with the capital to comply ahead of schedule.
Financing and add-on product regulation matters just as much on the profitability side. F&I revenue has become a critical offset to compressed front-end gross, and any tightening of disclosure or product rules around finance and insurance sales would compress a margin pool that many dealer groups are increasingly dependent on. Executives tracking share should watch state-level legislative activity around franchise protection and direct-sales pilots as closely as they watch OEM incentive changes, since a single legal ruling can reshape allocation dynamics faster than years of ordinary competition.
Regional and Vehicle-Segment Differences in Dealer Share
Dealer market share doesn't move uniformly across geography or vehicle category. Sunbelt states with faster population growth have seen more aggressive rooftop acquisition activity from public groups chasing expansion, while slower-growth regions in the industrial Midwest and Northeast tend to retain a higher share of long-held independent ownership. Group 1 Automotive's dual U.S. and U.K. footprint reflects one strategy for diversifying against regional demand swings, while other groups concentrate deliberately within single high-growth corridors.
Vehicle segment adds another layer. Truck and SUV-heavy dealers in rural and exurban markets have generally held share better than passenger-car-focused stores, reflecting the broader shift in national buyer preference. Luxury segment dealers, meanwhile, show less exposure to used-vehicle channel growth since luxury buyers lease more frequently and cycle vehicles faster, keeping new-vehicle volume proportionally higher at those rooftops than at mainstream brand stores.
EV-specific segment variation is emerging as its own category. Markets with strong charging infrastructure and state incentive programs are seeing EV-focused dealers and franchise points gain disproportionate attention from OEMs allocating limited EV inventory, while dealers in infrastructure-lagging regions face a longer runway before EV volume becomes a meaningful share contributor. Executives evaluating expansion or acquisition targets should weight regional infrastructure readiness alongside traditional demographic criteria.
How Dealers Are Fighting to Defend Their Share
Competitive response has clustered around a handful of repeatable strategies rather than one dominant playbook. Acquisition remains the most direct route for well-capitalized groups: buying aging independent rooftops adds both volume and franchise points without the multi-year wait for organic allocation growth.
Standalone used-vehicle brands represent a second strategy, visible in Sonic Automotive's EchoPark and CarMax's entirely used-focused model. Separating the used business from franchise-branded stores lets operators market more aggressively on price without diluting a new-vehicle brand's positioning.
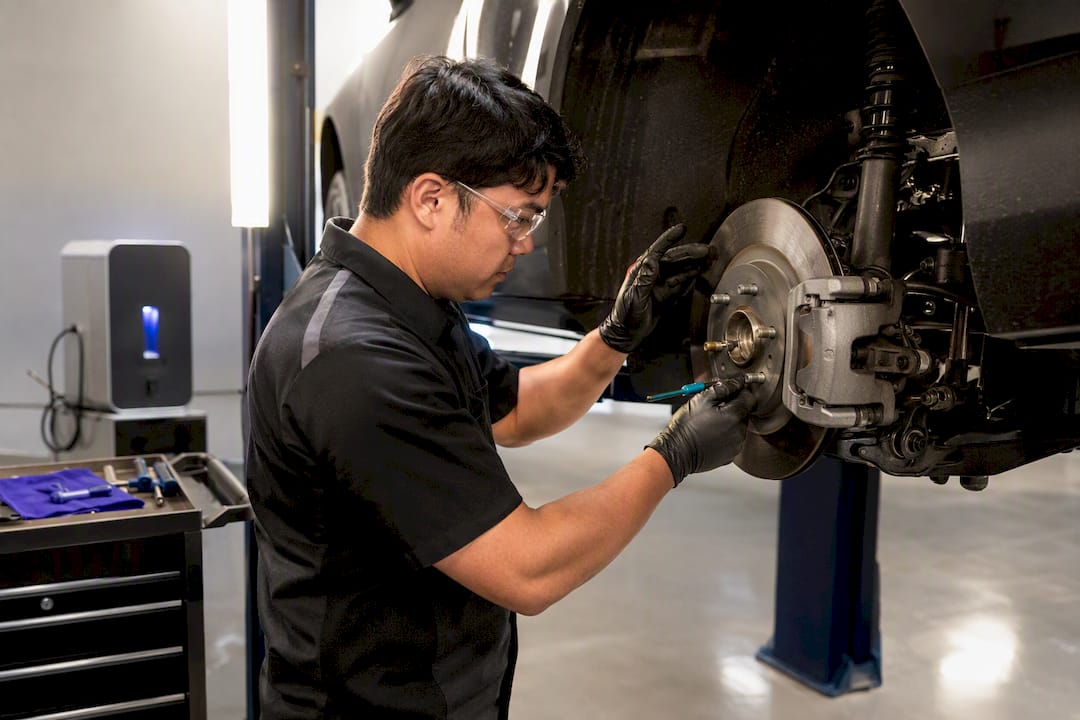
Service-lane investment has become a quieter but equally important defense. Dealers extending service hours, adding mobile service options, and building loyalty programs around maintenance retention are protecting the recurring revenue base that keeps a rooftop profitable between vehicle sales cycles. Given that service and parts revenue topped $164 billion industry-wide in 2025, that lane isn't a side business anymore, it's core defense against margin erosion.
Finally, groups with multi-brand or multi-state footprints are using geographic and brand diversification itself as a hedge, spreading exposure across regional economic cycles and reducing dependence on any single OEM's allocation decisions or production disruptions.
Digital Transformation's Role in Redrawing Dealer Share
Technology adoption has shifted from a customer-experience nicety to a genuine share-determining variable. Dealers offering full digital purchase paths, online trade valuation, and transparent pricing tools are capturing buyers who research and compare extensively before ever visiting a lot in person.
Inventory and pricing analytics tools have also changed how dealers source and price used vehicles, directly affecting the reconditioning and turn-rate metrics that separate top performers from the median. Groups using data-driven acquisition tools can identify underpriced wholesale inventory faster than competitors relying on manual auction review, feeding directly into the faster cash velocity that supports higher blended margins.
CRM and attribution technology sits at the center of the vendor-accountability question many executives are now asking. Choosing between analytics platforms like Power BI and Tableau for dashboarding vendor and sales performance data has become a real operational decision, not an afterthought, because the quality of a dealership's internal data infrastructure increasingly determines how quickly leadership can spot underperforming channels and reallocate budget before a full quarter of wasted spend passes. A detailed comparison of these platforms can help executives choose the right foundation before scaling their reporting stack further.
Where I'd Put the Next Dollar of Effort
If you're deciding where to focus over the next 18 months, start with a vendor data audit paired with a reconditioning speed program. It's the combination that delivers the best risk-adjusted return right now: one exposes wasted marketing spend with hard numbers, the other compresses cash-to-turn time without requiring new capital. Both are within reach for mid-market groups that will never match public dealers' cost of capital, and both move the KPIs that actually determine share.
**
Get an Independent Read on Your Market Position
Third-party providers give dealership executives what vendor scorecards rarely do: an independent, vendor-agnostic read on which marketing channels are actually earning their budget. Because some providers don't sell advertising, their recommendations aren't shaped by any incentive to protect a particular platform or agency relationship, the same conflict that makes most vendor-reported performance data hard to trust.

Engagements with some providers typically produce clear, defensible direction on where budget is misallocated and which vendors may be underdelivering against their own claims, giving leadership a prioritized roadmap rather than another dashboard to interpret. For dealership groups weighing where to reallocate spend heading into 2027 planning, an independent audit is a faster path to clarity than another round of vendor self-reporting. Visit the AutoROIQ advisory page to learn more about scheduling an independent marketing performance review for your dealership group.
Primary Sources Behind This Data
The figures in this analysis draw from four primary industry sources. NADA Data supplies the monthly and annual dealer financial totals, including unit sales and service revenue. Morningstar's US Auto Dealer Landscape report provides dealer-concentration and public-group analysis. Mordor Intelligence models market size and long-term forecasts. ResearchAndMarkets covers channel share, used-vehicle dynamics, and forecast assumptions cited throughout.