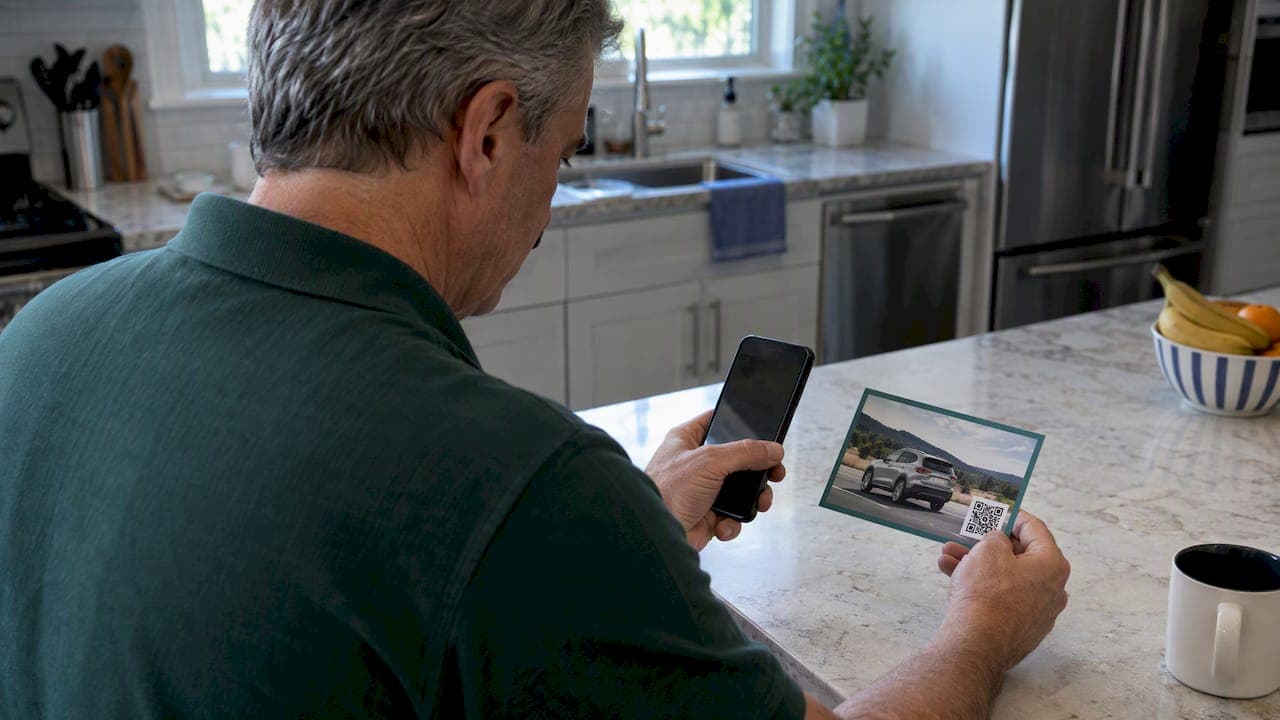
A good direct mail response rate for a dealership depends on the list. Mail to your own customers can reach 5% to 9%, while conquest mail to cold prospects often lands between 1% and 3%. The number only means something if you define what counts as a response and what you divided by. This guide covers the benchmarks, the formulas, and the attribution work that separates a mailer that got replies from one that sold cars.
TL;DR
- Published automotive averages sit around 3.84%, but they blend very different lists. Expect 5% to 9% from house lists and roughly 1% to 3% from conquest lists.
- A response is a call, a scan, a visit or a coupon redemption. It is not a sale. Define the event before the mailer drops.
- Tracked responses (phone numbers, QR codes, PURLs) undercount demand. A matchback of the mail file against DMS sales and repair orders shows the real result.
- Judge each campaign on DMS-confirmed gross and cost per sold vehicle or repair order, not on the vendor's response percentage.
Table of Contents
- What counts as a response
- The formulas to use
- Benchmarks: what is a good response rate?
- What moves response and profit
- How to track responses and attribute sales
- Comparing direct mail with digital
- Spotting mail spend that is not working
- Perspective: response is the beginning of the measurement, not the end
- Get an independent read on your mail results
- FAQ
- Sources
What counts as a response
Most disagreements about direct mail performance start with the definition. One vendor counts every phone call. Another counts only appointments. A third counts a sale found in the DMS that matches a name on the mailing list. All three can report a "response rate" and none of them are comparable.
A 2019 response-rate study shows how much the action matters. Rates fall as the ask gets harder: 4.60% for opting in for more information, 4.15% for requesting a call or consultation, 3.61% for returning a pre-addressed postcard, 3.00% for visiting a website, 2.49% for redeeming an in-store coupon, 2.04% for scheduling an appointment, and 1.13% for submitting an order with payment details.

For a dealership, that translates into a simple rule. A low-friction action such as a call or a QR scan will always produce a higher rate than a booked service appointment, and a booked appointment will always produce a higher rate than a sold vehicle. Pick the event you will count, write it down, and hold every vendor to it. One dealership measurement guide makes the same point: separate a "directions inquiry" from a "quote request" before the campaign, so this quarter's data can be compared with next quarter's.
It also helps to keep response and conversion apart. As a dealership-focused guide puts it, visits and calls are responses, while a purchase is a later conversion. A strong response rate does not guarantee a strong sales rate.
The formulas to use
Use the same math for every campaign and every vendor. The standard formulas, as laid out for dealership mailings, are:
- Response rate = (responses ÷ pieces delivered) × 100
- Conversion rate = (customers ÷ responses) × 100
- Cost per acquisition = total campaign cost ÷ new customers
- ROI = ((attributable revenue − campaign cost) ÷ campaign cost) × 100
The denominator deserves attention. One mail-measurement guide recommends dividing tracked responses by the valid mailed quantity and excluding returned or undeliverable pieces when reliable delivery data exists. If one vendor divides by pieces printed and another by pieces delivered, their percentages differ before a single customer responds.
A worked example
Say a dealership mails 5,000 service-reactivation postcards and 4,850 are delivered. Sixty-eight customers call, scan or book through tracked channels. The campaign costs $4,200.
- Response rate: 68 ÷ 4,850 = 1.4%
- Suppose a matchback against repair orders finds 91 customers on the mailing list who came in during the campaign window. The matchback rate is 91 ÷ 4,850 = 1.9%.
- If those 91 repair orders produced $18,200 in gross profit, ROI is ($18,200 − $4,200) ÷ $4,200 × 100 = 333%.
The numbers are illustrative, not a benchmark. The point is the gap between 68 and 91: tracked response alone would have understated the result by a quarter.
Benchmarks: what is a good response rate?
The figure most often quoted is the ANA response-rate average. A 2026 automotive direct mail playbook cites 3.84% for automotive, with house lists typically at 5% to 9% and conquest lists at 1% to 3%. A dealership-oriented advertising firm says its clients typically see 2% to 3%, counting visits and calls.
A single average hides the spread. A 2026 benchmark of tracked automotive campaigns reports these median response rates by campaign type:
| Campaign type | Median tracked response rate |
|---|---|
| Handwritten mail | 8.9% |
| Service and recall | 2.9% |
| Credit | 2.6% |
| Owner/database | 1.6% |
| Bankruptcy | 0.9% |
| Conquest | 0.8% |
These are tracked responses only, which the same source calls a floor rather than a ceiling for impact. Compare them with the house list and conquest ranges from the same publisher: house lists at 5% to 9%, conquest at about 2% to 5%. The ranges overlap in some places and diverge in others because the measurement method differs (tracked response versus matchback).
Service mail can run well above these figures when the audience is right. A 2019 case study of a Chrysler-Dodge-Jeep-Ram dealership reported an 11.24% response rate on a service mailer, equal to 27% of the store's service business for the period. Another report found an average 8.56% response across campaigns averaging 2,091 pieces, where about 80% of recipients were previous customers. Both are vendor-published results, so treat them as evidence of what is possible with a warm list, not as a target for a cold one.

Why benchmarks are hard to compare
One direct mail statistics guide warns that there is no universal benchmark. To compare any two numbers you need the report year, country, sample, audience, format, denominator and outcome definition. A self-reported purchase is not the same as an observed purchase tied to the mailing.
That is a practical filter for your own vendor reports. If a rep quotes "9% response" and cannot tell you the list type, the denominator and the event counted, the figure cannot be used to judge your campaign.
What moves response and profit
Four factors do most of the work.
1. The list. The biggest swing is between house and conquest. Your own sales and service customers know you. Conquest households do not. Segment by equity position, vehicle age, last service date, and lease or finance maturity rather than mailing the whole database. A Chevrolet service reactivation case credits audience segmentation and monthly list refreshes, so the same names are not recycled.
2. The reason to act. Benchmark data points to concrete, personal triggers such as due service or an open recall. "We want to buy your car" works when you can name the vehicle. A generic sale flyer does not.
3. The offer and the ask. The 2019 study above shows that a smaller ask draws more replies. That does not make the smaller ask better. A free-inspection coupon draws more responses than an appraisal offer, but the appraisal visit is closer to a sold vehicle. Match the ask to the goal.
4. Timing and market. Results vary by market, make and season. A tax-season equity mailer and a back-to-school service mailer will not behave alike. Keep a record by month so you compare like with like.
How to track responses and attribute sales
Tracked mechanisms are the first layer. Give every drop its own phone number, QR code and personalized URL. They give fast feedback, often within days, and they let you adjust before the next wave.
They are not complete. Many recipients walk in or search your name without using the tracked path, so tracked response undercounts real demand. The second layer is matchback: match the full mailing list against DMS sales and repair-order records for the campaign window, then count the hits.
For credible results, ask the vendor for:
- the match type used (for example full name and address), and the match rate
- source data pulled from your DMS, not the vendor's own system
- campaign results shown against dealership totals for the same period, which one mailing provider lists as a requirement for trustworthy attribution
The third layer is a control group. A 2026 luxury dealer study used DMV registration data to compare a targeted campaign against a non-marketed group and found a 3.2x higher buy rate. Holding out a random slice of your list tells you how many of those buyers would have come in anyway. That is the difference between response and incremental lift.
We cover these methods in more detail in our guides to direct mail attribution, offline sales match to sold VINs and a 90-day sales match analysis. If your mail drives calls, call tracking attribution closes the phone side of the gap.
Comparing direct mail with digital
The pages ranking for this keyword lean heavily on one claim: mail beats digital on response. The headline gaps (several percent for mail versus a fraction of a percent for email or display) are real in the published reports, but they compare different events. An email open or an ad click is a lighter action than a mailer-driven store visit.
The ANA gives one anchor. Its 2021 response rate report found respondents reported 112% ROI for letter-sized-envelope mail sent to prospect lists. That is a self-reported survey figure, not a dealership result.
A fair comparison puts each channel through the same test:
- Count sold vehicles and repair orders that match to the channel, using the same window.
- Divide the full cost, including list, print, postage, and agency fees, by those matches.
- Compare cost per sale and gross per dollar spent, not clicks against replies.
Mail often looks different under this test than under a platform report, and so do paid social and search. For a digital comparison point, see our Facebook Ads benchmarks for dealers, which sets cost per lead beside cost per sale. For channel-level cleanup, our guide to lead source attribution shows how to stop two vendors from claiming the same sale.
Spotting mail spend that is not working
Response rate alone is a misleading metric in automotive retail because it stops at the reply. Dealers who do well judge campaigns on sales matchback and DMS-confirmed revenue. Watch for these signs:
- The vendor reports responses but not matched sales. Ask for the matchback file.
- Results are compared with nothing. A campaign that "generated 120 sales" means little if the store sells 400 a month and baseline sales did not move.
- Different vendors claim the same deal. Add up each vendor's claimed sales for the month. If the total exceeds your actual sales, attribution is overlapping.
- List recycling. The same households mailed every month with falling response.
- No holdout. Without a control group, no one can say what the mailing added.
A geo test is another way to isolate effect. Our three-week geo targeting pilot shows how to compare mailed and unmailed areas without relying on any vendor's report.
Perspective: response is the beginning of the measurement, not the end
We do not sell advertising, manage campaigns or take commissions from vendors, so we have no reason to favor mail or any other channel. What we see in dealership reviews is consistent. Mail reports usually stop at the reply. The vendor shows a response percentage, the digital vendor shows leads, and the two reports add up to more sales than the dealership actually made.
Our view is that every mail campaign should be held to the same three questions. Which sold VINs and repair orders match the mailing list, using your DMS and not the vendor's data? How many of those would have come in without the mailer? What did each one cost, all in? When a vendor can answer these, the response rate becomes useful context. When a vendor cannot, the response rate is a marketing claim.
That is also why we separate benchmark from decision. A benchmark tells you whether a result is plausible. Only your own matched data tells you whether to renew the program.
— AutoROIQ
Get an independent read on your mail results
If your mail vendor's report and your DMS do not agree, our Marketing Intelligence Review compares what each vendor claims with what the dealership actually sold, and gives executives a clear recommendation on where spend is working. Because we do not sell advertising, the analysis is not tied to any vendor's renewal. Details on the review and on ongoing strategic advisory are on our FAQ page, and you can see more of our work in the marketing intelligence insights.

For a starting point, you can also visit AutoROIQ to see how our scorecards and channel evaluations work.
FAQ
What is a good response rate for automotive direct mail?
For mail to your own customers, 5% to 9% is a commonly cited range. For conquest lists, roughly 1% to 3% is typical. The all-industry automotive average cited in a 2026 playbook is 3.84%, but that blends both list types, so compare your result with the matching list type.
Is a response the same as a sale?
No. A response is the action you chose to count, such as a call, a scan or a visit. A sale is a later conversion. Divide customers by responses to get conversion rate, and track both so you can see where the funnel loses people.
How do I know whether a sale came from the mailer?
Match the mailing list against DMS sales and repair orders for the campaign window. Add unique phone numbers, QR codes and PURLs for immediate feedback, and keep a holdout group to estimate how many buyers would have come in anyway.
Does direct mail still outperform digital for car dealers?
Often it does on response, but the events being compared differ. Compare channels on matched sales and cost per sale over the same window, not on clicks versus replies. Mail wins some of those tests and loses others, depending on the list and the offer.
Sources
- DIRECT MAIL RESPONSE RATES (2019 study)
- Direct Mail Conversion Rate vs. Response Rate: Formulas
- Measure Direct Mail Success: A Bedford Advertising Guide
- Direct Mail Campaigns: Measure Performance & ROI
- Automotive Direct Mail: 2026 Playbook for Auto Dealers
- Automotive Direct Mail Benchmarks 2026
- Automotive Direct Mail Response Rates by Campaign Type
- Frisco CDJR Dealer service case study
- Northeast Cadillac LMA
- Direct mail statistics and campaign planning guide
- Chevy Dealer: 1,341 Service Customers Reactivated
- Automotive direct mail for dealerships
- Luxury Auto Dealer Case Study
- New ANA Study Shows Marketers Still Favor Email For Direct Mail