
Vendor accountability metrics are the quantified standards, evidence, and consequences that determine whether a supplier is meeting its commitments. The single most reliable system for enforcing them is a weighted vendor scorecard, built on four to five KPI categories, locked to SLA evidence, and tied to real commercial outcomes. Below, you'll find the categories, the scoring math, and the governance rules that turn a scorecard from commentary into leverage.
TL;DR:
- Vendor scorecards should prioritize four or more KPIs across multiple categories, weighted and normalized to a 0-100 scale for clear assessment.
- Targets and weights must be anchored to actual business outcomes, adjusted over vendor maturity, and assigned based on impact rather than gut feeling.
- Reliable evidence sources for KPIs must be clearly defined and verified through contractual audit rights to prevent disputes and ensure data accuracy.
- Score review cadence and escalation protocols should be tiered by vendor risk level, with formal corrective action plans for scores below 60 to drive real consequences.
- Incorporating early-warning KRIs and ESG metrics can identify future risks and improve strategic vendor management beyond current performance indicators.
Table of Contents
- What Are Vendor Accountability Metrics, and Which Categories Matter Most?
- Building a Vendor Scorecard: Template, Formulas, and Sample Targets
- How to Set Fair Targets, Tolerances, and Weights
- Turning KPIs into Auditable Evidence
- Making Scores Trigger Real Consequences
- Advanced Metrics: KRIs, ESG, and Strategic Value
- What AutoROIQ Brings to the Evaluation
- Why Vendor Data Is Hard to Get Right, and How to Fix It
- A Practitioner's View on What Breaks First
- Get an Independent Scorecard Review from AutoROIQ
- Sources
- FAQ
What Are Vendor Accountability Metrics, and Which Categories Matter Most?
Vendor accountability metrics only work when they map to a business consequence a supplier can actually influence. Most mature procurement teams organize their tracking around five categories: quality, delivery/reliability, cost/value, compliance/risk, and responsiveness. Each one answers a different question about supplier performance evaluation, and each pulls from a different data source.
Quality measures whether the output meets specification. Defect rate, first-pass yield, and return/rework percentage are the standard trio. A defect rate of 2% sounds small until you calculate it against volume: 2% of 50,000 units is 1,000 defective parts a month, each carrying a rework or scrap cost.
Delivery and reliability track whether the vendor shows up when promised. On-time delivery rate, order accuracy, and lead-time variance are the core metrics for vendor assessment here. On-time delivery is an outcome metric; to get a fuller picture, pair it with a fill-rate metric that measures completeness alongside punctuality.
Cost and value go beyond invoice price. Cost per unit, cost variance against contract, and total cost of ownership (including warranty claims, freight exceptions, and rework) tell you whether a "cheap" vendor is actually expensive once hidden costs surface.
Compliance and risk cover the vendor accountability indicators that protect you legally and reputationally: audit pass rate, certification currency, and contractual SLA adherence. These are typically owned by legal or quality assurance, not procurement alone.
Responsiveness measures how fast a vendor reacts when something breaks: average response time to a ticket, escalation resolution time, and communication cadence during an incident.
A few practical notes on ownership: quality and delivery data usually live in your ERP or WMS, cost data lives in your accounts-payable system, and compliance data often sits in a separate GRC or audit platform. Knowing who owns each data source before you build a scorecard prevents the single most common failure in vendor compliance metrics programs: nobody agrees on which number is real.
- Quality: defect rate, first-pass yield, rework percentage
- Delivery: on-time rate, fill rate, lead-time variance
- Cost/value: cost variance, total cost of ownership
- Compliance/risk: audit pass rate, SLA adherence, certification status
- Responsiveness: average response time, escalation resolution time
Building a Vendor Scorecard: Template, Formulas, and Sample Targets
A single accountability score works best when you have four or more KPIs across at least two categories, because a single-metric scorecard invites gaming. The weighted scorecard approach solves this by converting every KPI, regardless of its unit, into a common 0 to 100 point scale, then summing weighted results into one number leadership can act on.
The math is straightforward. For "high is good" metrics like on-time delivery, the formula is: (actual / target) × 100, capped at 100. For "low is good" metrics like defect rate, invert it: (1 − (actual / target)) × 100. Multiply each KPI's normalized score by its assigned weight, then sum the results for your final score out of 100.
Here's a compact scorecard structure you can adapt directly:
That structure mirrors the approach most vendor scorecard playbooks recommend: three to seven KPIs, each with a named evidence source and a review frequency, rolled into one weighted number rather than a scattered dashboard nobody reads.
Targets should adapt over the life of the relationship, with new vendors in a "ramp" phase having looser tolerances and vendors maturing to tighter targets over time. Order-accuracy targets for third-party logistics providers typically begin at a high level during a ramp period and become stricter as the relationship matures, while email-deliverability vendors show increasing inbox placement targets from moderate to higher rates across the same maturity stages, according to scorecard benchmark data. If you're onboarding a new supplier, a scorecard-based evaluation approach at the selection stage sets the baseline you'll measure against later.
Pro Tip: Score every vendor on the same 0 to 100 scale even if their KPI mix differs. A logistics vendor and a media vendor should never be compared metric-for-metric, but their final scores should sit on a common scale so an executive can rank all vendors on one list.
How to Set Fair Targets, Tolerances, and Weights
Weights and targets are where most vendor risk management metrics programs go wrong, usually by setting numbers that feel reasonable rather than numbers tied to what actually moves your business. Four rules keep the process defensible.
- Anchor targets to the business outcome the vendor can move. If a marketing vendor's job is generating qualified leads, the target belongs on cost per qualified lead, not impressions delivered. Impressions are activity; leads are outcome. AutoROIQ's agency performance metrics guidance applies this same outcome-first logic to dealership marketing vendors specifically.
- Ramp targets over the relationship's maturity. A vendor in month two should not be held to the same tolerance as a vendor in year two. Build three bands: ramp (looser, months 0 to 6), steady (contract standard, months 6 to 18), and scale (tighter, 18-plus months), with numeric targets rising at each stage.
- Assign weights by business impact, not gut feel, and confirm they sum to 1.0. A vendor whose failure halts your production line should carry heavier weight on delivery than a vendor supplying a non-critical component. If quality failures create legal exposure, weight compliance higher even if the vendor's cost is trivial.
- Define tolerance bands and cure periods before you need them. A single missed target shouldn't trigger a penalty; a green/yellow/red band with a defined cure period (commonly 30 to 60 days) gives the vendor a fair chance to correct before consequences kick in. SLA credit examples, such as a 2% invoice credit per percentage point below the delivery target, should be written into the contract, not improvised after the fact.
Turning KPIs into Auditable Evidence
A KPI is only as trustworthy as the evidence behind it, and this is where most vendor accountability indicators fall apart in practice. Every metric on your scorecard needs a named source system, a defined sampling method, and a review cadence, or the number becomes a matter of opinion during a dispute.
Common evidence sources include your ERP or WMS for delivery and inventory metrics, your accounts-payable system for cost variance, a ticketing platform like Zendesk or ServiceNow for responsiveness, and a dedicated GRC or audit tool for compliance records. A practical mapping example: on-time delivery pulls from WMS shipment timestamps sampled monthly; defect rate pulls from QA inspection logs sampled per batch; SLA adherence pulls from the signed contract's service log, reviewed monthly against the actual outage or incident record.
Automation reduces disputes but introduces its own risks. Manual data entry and inconsistent metric definitions across business units are the two most common integration pitfalls, particularly when procurement calculates "on-time" one way and the vendor calculates it another. Standardize the definition in the contract itself before automating collection.
- ERP/WMS: delivery timestamps, order accuracy
- AP system: invoice cost variance, payment terms compliance
- Ticketing platform: response and resolution time
- GRC/audit tool: certification status, audit findings
Give yourself contractual teeth here. A vendor contract review should confirm the agreement explicitly grants data access and audit rights, so you're never negotiating for evidence after a dispute has already started.
Pro Tip: Write the audit-rights clause before you write the scoring formula. A scorecard with no contractual right to pull the underlying data is a scorecard the vendor can simply dispute into irrelevance.
Making Scores Trigger Real Consequences
A score that never changes a commercial decision is not an accountability system, it's a report. Review cadence should scale with vendor tier: monthly for critical/high-spend vendors, quarterly for standard vendors, and semiannually for low-risk, low-spend suppliers, with an automatic trigger for an urgent off-cycle review whenever two consecutive periods land in the red zone.
An escalation ladder gives structure to what happens next. A single red flag might warrant a warning email; two consecutive red flags or a cross-KPI failure (quality and delivery both missing target in the same period) should trigger a formal corrective action plan.
That plan needs a template, not a conversation: a named owner on the vendor's side, dated milestones, specific evidence required to close each milestone, and a hard timeline (typically 30 to 90 days). Texas's state procurement system offers a useful public model here: its Vendor Performance Tracking System grades vendors A through F, requires documentation for any grade of D or lower, and defines a formal pathway toward debarment for repeated failures.
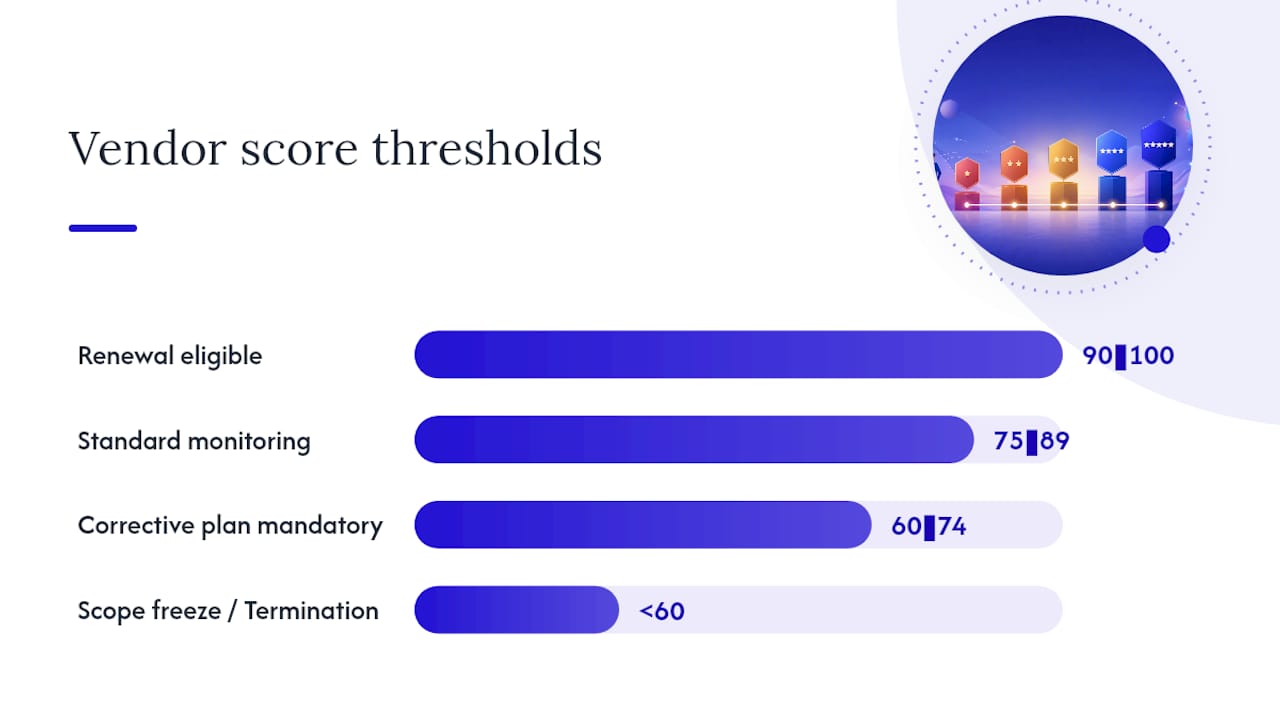
Commercial consequences should map directly to score thresholds:
- Score 90 to 100: renewal eligible, potential scope expansion
- Score 75 to 89: standard monitoring, no action required
- Score 60 to 74: corrective action plan mandatory, SLA credits applied
- Below 60: scope freeze, rebid consideration, or termination review
Advanced Metrics: KRIs, ESG, and Strategic Value
Key performance metrics for suppliers measure what already happened. Key Risk Indicators (KRIs) are meant to warn you before it happens again. Financial-stress signals (credit downgrades, late payments to their own suppliers), security-audit findings, and missed compliance audits all function as early-warning KRIs, distinct from the outcome-focused KPIs on your scorecard, according to guidance on separating KPIs from KRIs.
ESG indicators are increasingly part of vendor compliance metrics, particularly for sectors with sustainability reporting obligations. Practical ones include carbon-intensity per unit produced, labor-audit pass rates, and supplier-diversity spend percentage. Methodologies like S&P Global's Supplier Risk Management framework aggregates dozens of question-level indicators into a single 0 to 100 score mapped to labeled bands from "very weak" to "very strong," which is a useful model for benchmarking against sector norms rather than inventing your own scale from scratch. Research also shows that scoring alone changes little; pairing ESG scores with active supplier engagement correlates with real performance improvement, according to a quantitative sustainability assessment framework.
- KRIs: financial stress signals, security findings, audit failures
- ESG: carbon intensity, labor-audit pass rate, diversity spend
- Strategic value: innovation contribution, capped at low weight
What AutoROIQ Brings to the Evaluation
An evaluation methodology uninfluenced by vendor interests holds weight with dealership leadership. The scorecard logic above draws on the same evidence-first discipline behind AutoROIQ's agency scorecard template and its work reviewing dealership marketing spend for measurable ROI.
Why Vendor Data Is Hard to Get Right, and How to Fix It
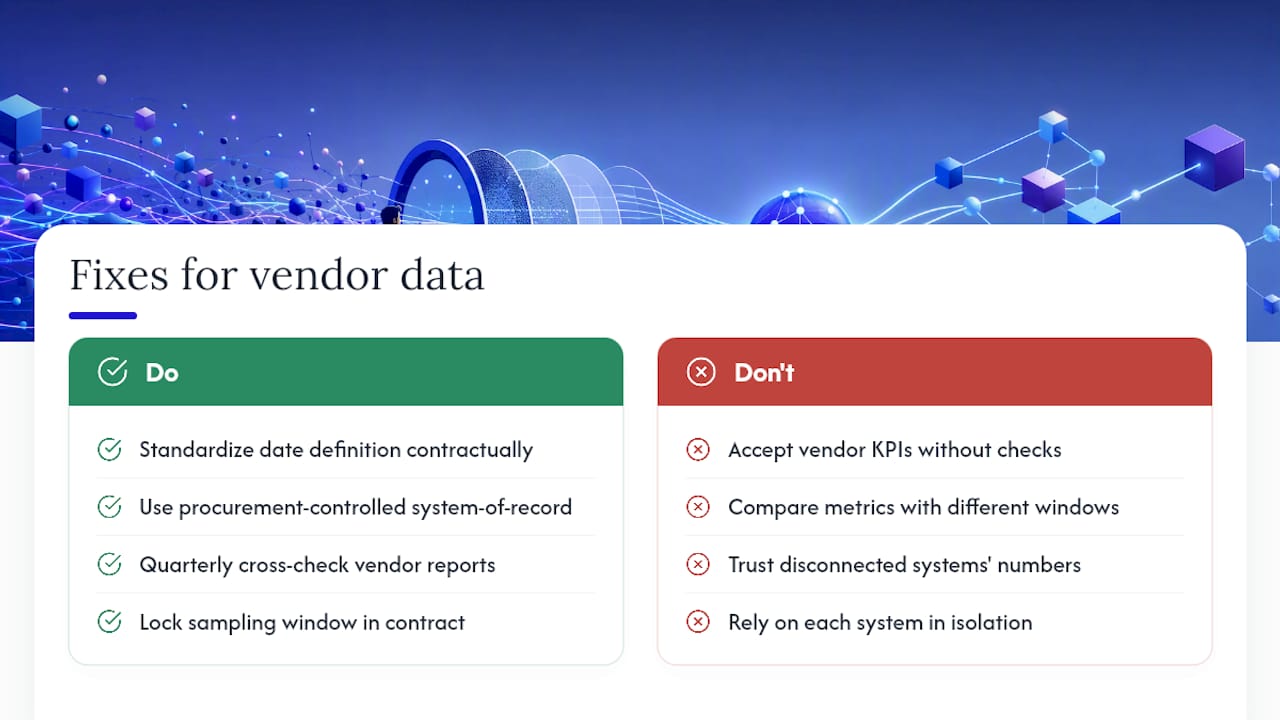
Getting accurate vendor data is harder than building the scorecard itself. The most common failure isn't a missing metric, it's a definitional mismatch: procurement calculates "on-time" from purchase-order date while the vendor calculates it from ship date, and both sides show up to the review convinced they're right.
Self-reported vendor data compounds the problem. A vendor grading its own on-time delivery has an incentive to round favorably, so critical KPIs need a system-of-record source procurement controls directly, not a number pulled from the vendor's own dashboard. Where self-reported data is unavoidable, cross-check a sample against your own records quarterly rather than trusting it wholesale.
Inconsistent sampling windows create a second failure point. Comparing a vendor's Q1 performance calculated over 90 calendar days against Q2 calculated over 91 days sounds trivial until volume swings make the percentages misleading. Lock the sampling window and the calculation method into the contract, not just the target.
Fragmented systems are the third obstacle. Delivery data in the WMS, cost data in accounts payable, and compliance data in a separate audit tool rarely talk to each other, which is why manual reconciliation remains the default for most mid-market procurement teams. A dealership marketing audit approach, applied more broadly, works because it forces a single reconciled data pull before any score gets calculated, rather than trusting each system's number in isolation.
A Practitioner's View on What Breaks First
Scorecards fail for predictable reasons: too many KPIs dilute focus, scores with no consequence get ignored, evidence sources stay undefined, and review cadence drifts. Fix each by cutting to five KPIs, tying scores to contract action, naming a source per metric, and locking a calendar.
— AutoROIQ
Get an Independent Scorecard Review from AutoROIQ
Building the scorecard is the easy part. Defending it when a vendor disputes the score, or discovering too late that your "quality" agency and "cost-efficient" media buyer were never actually delivering, is where most procurement teams get stuck. There are services offering independent, vendor-agnostic reviews of marketing vendors that do not sell media or take agency commissions and that provide unbiased vendor performance evaluations.

For dealership leaders, this means access to outside evaluations of marketing vendors against typical performance categories, delivered as actionable executive-level recommendations rather than static reports. If your current vendor scorecards are producing scores nobody trusts or disputes nobody can resolve, start with a pilot review through AutoROIQ and get a defensible, independent read on where your marketing budget is actually working.
Sources
For deeper implementation detail, consult S&P Global's supplier risk methodology for ESG scoring structure and the Texas Attorney General's vendor performance procedures for a governance model with mandated documentation.
- Vendor scorecards that actually drive accountability: a complete playbook | Bryce Hamrick
- Supplier Risk Management methodology | S&P Global
- Vendor risk management metrics: KPIs vs KRIs | Vanta
- Vendor performance evaluation procedures | Texas Attorney General
FAQ
What Are Accountability Metrics?
Accountability metrics are measurable standards tied to evidence and consequences, used to confirm whether a vendor or supplier met its contractual commitments rather than simply tracking activity.
What Are Five Examples of Metrics Used to Measure Vendor Performance?
On-time delivery rate, defect rate, cost variance against contract, SLA adherence, and average response time cover the five most common vendor performance evaluation categories.
What Metrics Commonly Appear on a Vendor Scorecard?
Most scorecards use three to seven core KPIs spanning quality, delivery, cost, compliance, and responsiveness, each normalized to a 0 to 100 scale and combined into one weighted score.
How Do I Evaluate Vendor Performance?
Evaluate vendor performance by defining four or five weighted KPIs tied to named evidence sources, scoring them monthly or quarterly, and connecting the resulting score to real commercial outcomes like credits or contract renewal. Independent reviews, such as those AutoROIQ conducts for dealership marketing vendors, add an unbiased check when internal scoring is disputed.
What Is the Difference Between a KPI and a KRI?
A KPI measures current delivery or value against a target, while a KRI is an early-warning signal, such as a financial-stress indicator or audit finding, that predicts future vendor failure before it shows up in KPI results.